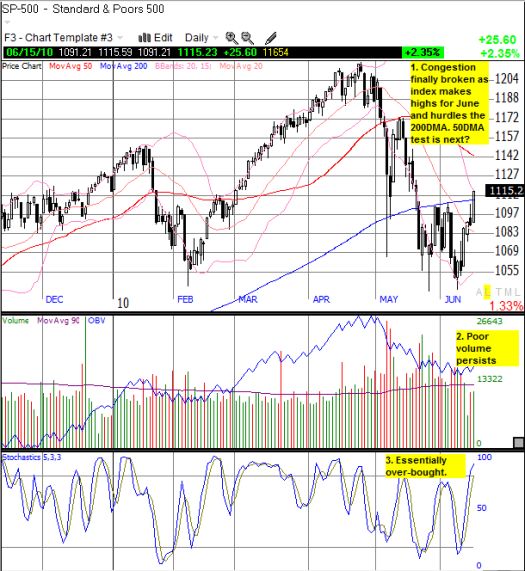
Two weeks ago, I wrote “Sellers Step Out of the Way” to describe an impressive rally from oversold conditions on poor volume on May 27th. The S&P 500 closed up 3.3% that day, just short of the 200-day moving average (DMA). Today, the index finally hurdled over the 200DMA resistance for the first time in three weeks. Unfortunately, volume was even worse than the rally two weeks ago. With technicals essentially over-bought, the stock market is vulnerable to a one-day reversal just as large as today’s gains. I fully expect such a sell-off within a week, especially given this week is an options expiration week (“quadruple witching” too). Those of us still patient enough to play a bounce from previous oversold conditions were compelled to lighten up on longs into today’s bounce.
It is even difficult to find a solid catalyst for today’s rally given all the moaning and groaning we just heard about Friday’s poor retail sales numbers. THOSE numbers printed just a week after the agonizing over extremely poor employment numbers. The S&P 500 now rests above the closes of both those days as it posts its high for June.

*Chart created using TeleChart:

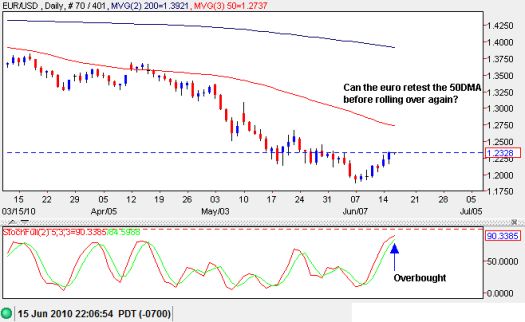
The main catalyst to watch is now the euro. It seems as long as the relief rally in the euro continues, bulls will take heart. The few buyers out there will remain numerous enough to lift stocks a little bit more. However, the euro is also now overbought. I have taken this opportunity to start building a fresh short position.

Source: dailyfx.com charts
Be careful out there!
Full disclosure: long SSO puts and calls, short EUR/USD, long EUR/CHF

I expect a rally to at least 1150 (perfect setup for head and shoulders) or 1170 (double buttom target). Lets see if it will form a SHS or make a new top…
Yes volume was not particularly high considering the volatility, but technical setup is still bullish. 1040 continues to be very good support.
I think 1150 is a stretch in the near-term. I could see that after the market works off the current over-bought conditions though. I do realize low volume has not meant much for stretches like the March-April melt-up. But it means a lot in terms of the amount of selling pressure that comes when sellers see enough profits to take, like the selling in May.
Regardless, I expect a lot more up and down churn than directional movement for much of the summer at this point.
Thanks for the input!