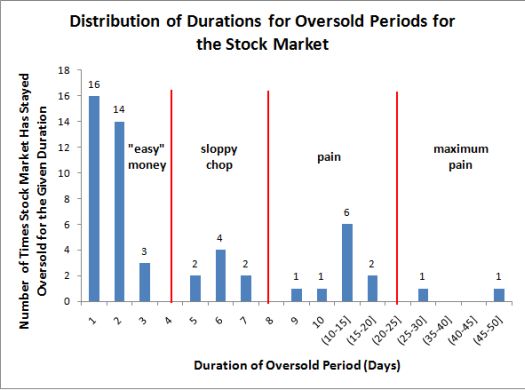
T2108, the percentage of stocks trading above their 50-day moving averages (DMA), hit 21% on Wednesday. This milestone finishes nine days of technically oversold trading conditions as defined by T2108 dropping to 20% or below. I am reposting below a chart of the historical distribution of durations for oversold periods as a reminder that the stock market reached extremes rarely seen. The market was also likely on the edge of registering bigger losses before some kind of bottom finally formed:

Source: Worden Telechart
After all the chop and churn throughout the oversold period, the S&P 500 is still 1.5% below its close on the first oversold day on 5/19. The following day, the VIX closed at its highest point since the March, 2009 lows. This event punctuated the strength of the negative sentiment. The S&P 500 is up 2.5% from its close on that day. By the sixth day of the oversold period, I was forced to scale back my most aggressive trades and take a more hedged position. So, I rode out of the oversold period with more bearish bets than I would have liked. Given the day’s light upside volume, combined with the major indices stuck in or below key resistance levels, it is probably best to remain modestly hedged. I will not be surprised if the market soon dips back into another oversold trading period.
After the market’s first up day of the oversold period, I posted a list of candidate stocks for buying based on a “bearish engulfing pattern.” I divided these stocks into the following tiers:
As a reminder, here are the tiers (as measured from trading action from 5/20 [“Thursday”] to 5/21 [“Friday”]):
- Tier 1: closed above the 50DMA and the 200DMA and never crossed the 200DMA (41 stocks)
- Tier 2: successfully tested the 200DMA support. Thursday’s selling did not break the 200DMA whereas Friday’s action took the open or the low of the day below the 200DMA. (14 stocks)
- Tier 3: closed on Thursday below the 200DMA and closed above it on Friday. (40 stocks)
- Tier 4: traded above the 200DMA but never crossed the 50DMA which remains overhead (104 stocks)
- Tier 5: traded below both the 50 and the 200DMA (129 stocks)
The stocks in the first Tier performed best over the first few days I tracked performance. However, with the oversold stretching to extremes, the picture is much more mixed. While only two Tier 1 stocks fell below the 50DMA, overall performance pushed Tier 1 to the back of the pack. Tiers 2 and 4 emerged as the clear winners. I am guessing that duration of the oversold conditions eventually motivated sellers in the strongest stocks, and the push out of these extremes motivated a lot of buying in under-performing stocks in an attempt to generate out-sized gains. (I earlier speculated that as buyers squeezed the market out of its oversold conditions that under-performing stocks could be the biggest beneficiaries).
The table below summarizes the performance of the different tiers of stocks. The correlations suggest that early performance of individual stocks is not a reliable indicator of final performance. However, the correlation of the average price gains in a tier on the first up day of the oversold period correlated relatively well with the final average performance (correlation = 0.77). The average one-day performance on the first oversold day had a weaker relationship to final average performance (correlation = 0.58).

Overall, this latest oversold period ended inconclusively. A convincing bottom has not formed, and a lot of technical damage has left the market with stiff overhead resistance levels. On the other hand, the propensity for the market to print big gains on any given day puts the bears on edge. Under these conditions, I will continue to maintain a small basket of puts, shed longs into rallies, and nibble on dips.
Be careful out there!
Full disclosure: long SSO calls; positions still held from candidate list of stocks: long ICE, long WHR, long NFLX put spread, long FFIV (hedged), long DNDN, long TLB
