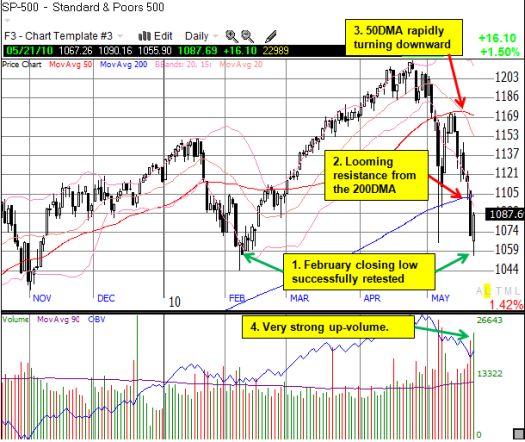
The most striking characteristic of May’s selling has been the precision of the S&P 500 as it has bounced around key technical levels of support and resistance. On these pages, I have chronicled almost each important step and juncture in this sell-off, and I continue to marvel at how well trades have fared that stay faithful to the technical signals.
Now, the stock market has delivered another bounce from oversold conditions. It unfolded just as I had hoped when I outlined my strategy for playing a potential bounce on Friday:
“With the market closing on [Thursday’s] lows, I am expecting extreme downward pressure on Friday’s open. Such a move will provide an ideal opportunity to accelerate accumulation of long positions and perhaps sell most of my remaining June puts on individual stocks. If instead we gap up or have a strong rally for most of the session, I will most likely do nothing.”
The S&P 500 opened down 1.5%, less than one point below the February, 2010 closing low of 1056.74. The index immediately sprinted into positive territory in less than 30 minutes. If you blinked, you missed it (I sure couldn’t move fast enough for everything I wanted to accomplish!). However, there were several opportunities throughout the day to catch the S&P 500 at Thursday’s closing price – unexpected behavior for an otherwise strong rally from oversold conditions. The S&P 500 closed the day up 1.5% and barely avoided the dreaded lower low that would have marked the likely beginning of a downtrend.
Friday’s rally produced a type of “piercing line” pattern on the S&P 500 that stopped a few points short of closing at the midpoint of Thursday’s sell-off. Traditionally, this signal is considered a potential reversal pattern if the rally reclaims at least the midpoint of the previous day’s selling (see my analysis of GOOG and RIMM for examples of piercing patterns that came up short and produced bearish implications). With the 200-day moving average (DMA) looming directly overhead, the index has a lot to prove before it can convince us that it has printed some kind of (near-term) bottom. The daily and intra-day charts below summarize the technical set-up (note that stochastics are also oversold but not shown):

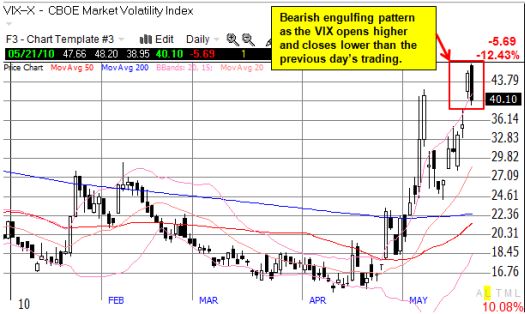
The VIX added support to the case for a near-term bottom. Friday’s rally produce a bearish engulfing pattern on the VIX, a classic sign of a reversal of a previous uptrend.

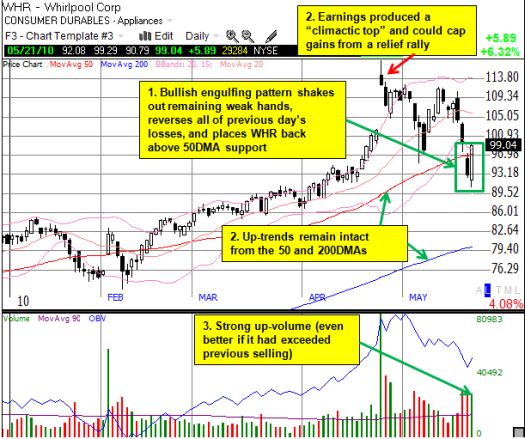
While the S&P 500 did not quite print a convincing bottom, the buying was was so strong that several stocks emerged from the carnage with very convincing bullish reversals. Of course, Friday’s options expiration may have distorted trading, but I am keen to give these strong reversal patterns the benefit of the doubt. These reversals came in the form of bullish engulfing patterns. The bullish engulfing pattern is the converse of the bearish engulfing pattern. It is also the logical extreme of the piercing pattern in that the stock has reversed all the selling of the previous day. The higher the close, the more bullish the reversal.
My scan of individual stocks turned up so many bullish engulfing patterns that I had to apply more rigorous filters to manage the review process. I discarded any stock whose up-volume on Friday was not at least 90% of Thursday’s down-volume. I also discarded indices and stocks that had very low overall trading volume. I next segmented the reversal candidates according to their positions relative to the critical 50 and 200DMAs. (Note that nearly all these stocks have oversold stochastics.) This process produced 41 particularly impressive stocks that closed the day above their respective 50-day moving averages. Only one of these stocks ever violated its 200DMA, and in all cases the 200DMAs remain in strong up-trends.
Whirlpool (WHR) is one of the strongest candidates from this group. WHR nearly doubled its average trading volume, and it had the 6th highest one-day gain. Of the top 6 gainers, only KERX traded with higher one-day volume. I post WHR’s chart below as an example of a strong bullish engulfing reversal:

*All charts created using TeleChart:

WHR is a buy here with a stop below the 50DMA – volatility may require a looser stop than usual. A second close below the 50DMA makes WHR vulnerable to further downside and would put the recent lows in jeopardy. The fundamental story on WHR relies on robust growth in emerging economies, especially in Brazil and India. Thus, the bullish trading case on WHR will also depend on a sharp reversal in sentiment for the prospects for the global economy.
I have posted below a list of the 41 stocks that appear to have the strongest potential for bullish follow-through. I have sorted this list in descending order based on the trading range measured from the close to the day’s low. WHR places 9th on this list.
| Symbol | Company Name |
Trading Range |
| CPWM | Cost Plus Inc California | 17.9% |
| OSTK | Overstock.com Inc |
14.3% |
| KERX | Keryx Biopharmaceuticals |
14.2% |
| PHX | Panhandle Oil and Gas Inc |
13.2% |
| SCSS | Select Comfort Corp |
12.9% |
| NENG | Network Engines Inc |
12.6% |
| CRUS | Cirrus Logic Inc | 10.5% |
| NFLX | Netflix Inc | 9.5% |
| WHR | Whirlpool Corp | 9.1% |
| SM | Saint Mary Land & Explor |
8.9% |
| TLB | Talbots Inc | 8.3% |
| IRBT | iRobot Corp | 8.2% |
| ALK | Alaska Air Group Inc |
7.9% |
| KNL | Knoll Inc | 7.7% |
| S | Sprint Nextel Corp |
7.6% |
| BIDU | Baidu` Incorporated |
7.3% |
| EXR | Extra Space Storage Inc |
6.9% |
| ICE | Intercontinental Exchange Inc |
6.6% |
| EQR | Equity Residential |
6.5% |
| SGEN | Seattle Genetic | 6.2% |
| FFIV | F5 Networks Inc | 6.2% |
| HXL | Hexcel Corp | 6.0% |
| UNFI | United Natural Foods Inc |
5.8% |
| LTM | Life Time Fitness |
5.6% |
| UDR | Udr Inc | 5.3% |
| CATO | Cato Corporation (the) |
5.2% |
| CMG | Chipotle Mexican Grill |
5.2% |
| SSS | Sovran Self Storage Inc |
4.9% |
| HAIN | Hain Celestial Group Inc |
4.7% |
| CTS | Cts Corp | 4.5% |
| VASC | Vascular Solutions Inc |
3.9% |
| DNDN | Dendreon Corporation |
3.7% |
| THS | TreeHouse Foods Inc |
3.7% |
| ECL | Ecolab Inc | 3.7% |
| MCK | Mckesson Corp | 3.5% |
| FRED | Fred’s Inc | 3.2% |
| ECPG | Encore Capital Group |
2.9% |
| TSCO | Tractor Supply Co |
2.7% |
| SRCL | Stericycle Inc | 2.7% |
| GCOM | Globecomm Systems Inc |
2.5% |
| CPB | Campbell Soup Co | 2.2% |
My scan and filter caught 288 other stocks. I just summarize these stocks by reporting how many fell into each DMA-based category:
- 15 stocks successfully tested the 200DMA support. Thursday’s selling did not break the 200DMA whereas Friday’s action took the open or the low of the day below the 200DMA.
- 40 stocks closed on Thursday below the 200DMA and closed above it on Friday.
- 104 stocks above 200DMA but did not penetrate 50DMA
- 129 stocks below the 50 and 200DMA
Note well, I am not making any guesses as to how long these potential bottoms will last or how much potential upside exists in any relief rally. I do continue to believe that serious technical damage has occurred, and the S&P 500 appears headed lower over the course of this year. I am expecting Monday to feature a lackluster open and follow-through on many of these bullish trading opportunities may take a day or two (absent new catalysts to propel stocks). Overhead resistance will stall, if not outright stop, most rally attempts. In other words, the easy days are over where stocks float upward on light trading volume. Sellers have finally become interested in liquidating, locking in profits, and/or reducing risk. I am only interested in the bull case during oversold periods like the two the stock market has delivered this month.
Be careful out there!
Full disclosure: long SSO calls, long NFLX put spread

Phenomenal work. Thank you.