The percentage of stocks trading above their respective 40-day moving averages, T2108, closed at 19%, below the 20% threshold that indicates an oversold stock market. The stock market has reached these levels only one other time since the March, 2009 lows – this was in February when the market last cared about the sovereign debt issues in Europe.
There are three main factors supporting a notable rebound within the next few days:
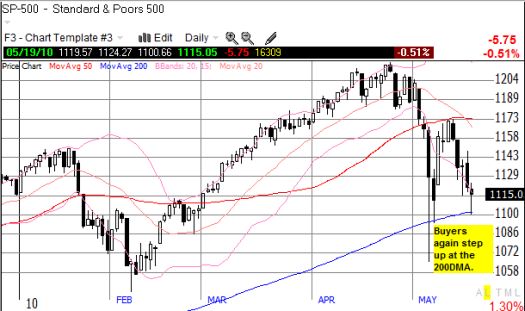
- The S&P 500 successfully tested the 200DMA support line again (chart posted at the end of this post). This behavior will embolden buyers. If the S&P 500 pierces, or even closes below, this support level, selling should reach a climax as stops get hit and sellers and shorts over-reach. This event would likely take T2108 to a lower low below May 7th’s 15% close. This behavior would be consistent with my expectations for on-going lower lows for this indicator. This event should generate an even sharper bounce off oversold conditions.
- The January to February sell-off took the S&P 500 down 9.2% from the highest close in January to the intra-day lows in February. You guessed it, 9.2% below the April closing highs takes the S&P 500 to 1104, directly above the 200DMA.
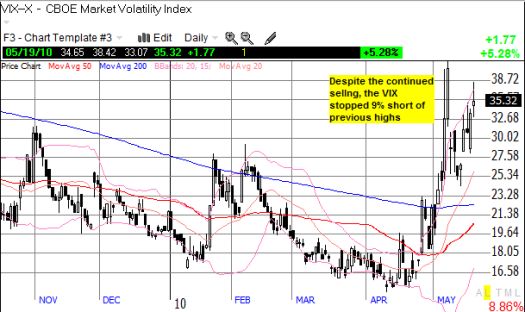
- Wednesday’s high on the VIX traded “close enough” (9%) to the highs from the last oversold period. (See “Does the VIX Need to Spike at A Climactic Low?” for a discussion of the relationship between the VIX and T2108).

And let’s not forget that Friday is options expiration day – a great day for government intervention to goose stocks higher. The on-going drama in Europe provides a great catalyst for such a move.
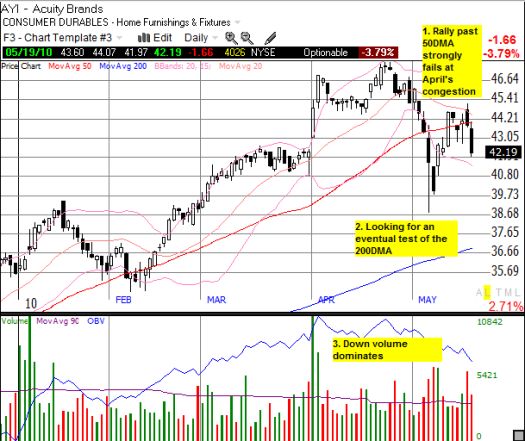
In anticipation of a bounce, I loaded up on May calls on QQQQ. If the market sells off further on Thursday, I will add (June) calls on SSO. I have sold almost all of my puts expiring in May, but still hold numerous June puts in individual stocks that are experiencing significant breakdowns. Acuity Brands (AYI) is one example of an accident waiting to happen; its chart is posted below the chart of the S&P 500. (I lasted reviewed AYI earnings in April).


*All charts created using TeleChart:

Be careful out there!
Full disclosure: long QQQQ calls, long AYI puts
