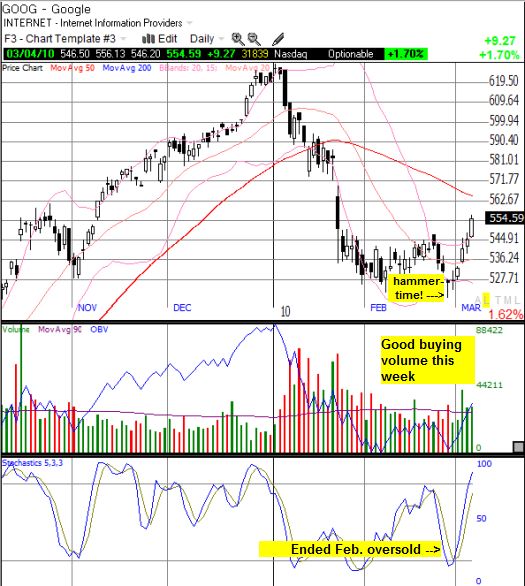
Google (GOOG) has had a rough 2010. While the NASDAQ is up 1% for the year, GOOG is down 10%. Buyers have finally flocked to GOOG in the past week as the stock hit oversold levels, and the stock has perked up for the first time in 2010. (GOOG was one of several stocks I picked for a “beginning of the month” trade that takes advantage of strong selling that ends the prior month).
The chart below shows the current bullish set-up. GOOG ended February oversold, punctuated with a bullish reversal hammer pattern. The subsequent bounce has featured strong buying volume, implying a high likelihood that a short-term bottom is in place.

*Chart created using TeleChart:

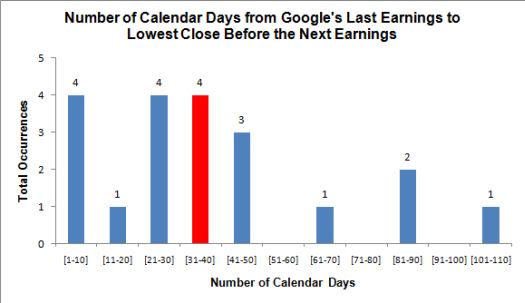
I also like to think of GOOG in terms post and pre-earnings trades. I used data from my GOOG earnings trading analysis to calculate that there is roughly a 65% chance that GOOG has finally printed a bottom before the next earnings statement in April. Assuming past history points the way to the future, this statistic confirms the bullish technical set-up.
The histogram below shows the distribution of total calendar days from a GOOG earnings report to a closing low for the stock before the next earnings report. GOOG’s lowest point so far occurred at calendar day #35 from January’s earnings report. Out of 20 earnings cycles, 13 have featured lows occurring no later than that (13/20 = 0.65). For ease of display, I divided the chart into 10-day blocks. The red bar includes the timing of the current low.

Be careful out there!
Full disclosure: long GOOG
