RIMM officially began its share repurchase period on Monday, November 9. Since then, the intra-day trading seems to provide evidence that RIMM (or some other large buyer!) has gone to work purchasing shares.
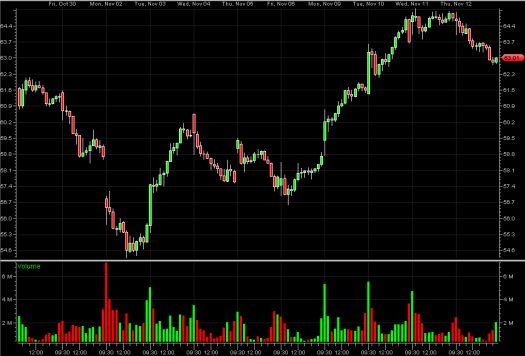
The chart below shows a 10-day chart of RIMM with trading broken into 30-minute blocks. The first 30-minutes of trading on Monday, Tuesday, and Wednesday show an atypical spike in volume (see the three large green bars at the bottom at to the right of the chart). Each of those days, RIMM experienced significant increases in stock price. However, on Thursday (today), opening trading volume sank back to “normal,” and the day ended with a significant drop in price. (The large volume from last Tuesday, Nov 3 came on the heels of an analyst upgrade).

The specific numbers are posted below. I included the price change in the QQQQ for comparison. The format is as follows: [day of week: volume of shares traded in first 30 minutes of the day, RIMM’s closing price change, and QQQQ’s closing price change]
Fri (Nov 6): 2.5M, 1.6%, 0.6%
Mon: 5.33M, 4.8%, 2.1%
Tues: 5.54M, 3.4%, 0.23%
Wed: 4.72M, 1.7%, 0.6%
Thurs: 2.45M, -2.5%, -0.6%
These data also provide a method for roughly estimating how much money the large buyer spent on RIMM over the past three days. If we assume that 2.5M is the very rough average trading volume for the first 30 minutes of trading (reasonable considering average daily volume is around 17M), then an extra 8.09M shares traded hands Monday through Wednesday. If we assume that the large buyer secured each day’s opening price ($59.34, $61.49, and $64.61, respectively), an extra $514M was spent on RIMM stock. This is clearly large enough to encompass RIMM’s repurchasing activity. If RIMM repeats previous repurchasing behavior, these three days represent all the buying it will do this fiscal quarter, absent some new, significant drop in its share price (reminder, $50 is the next level of support as it fills the up-gap from April). These are a lot “IFs,” but they provide a frame of reference in interpreting trading in RIMM shares going forward. RIMM will most likely report any repurchasing activity in its next quarterly report sometime next month.
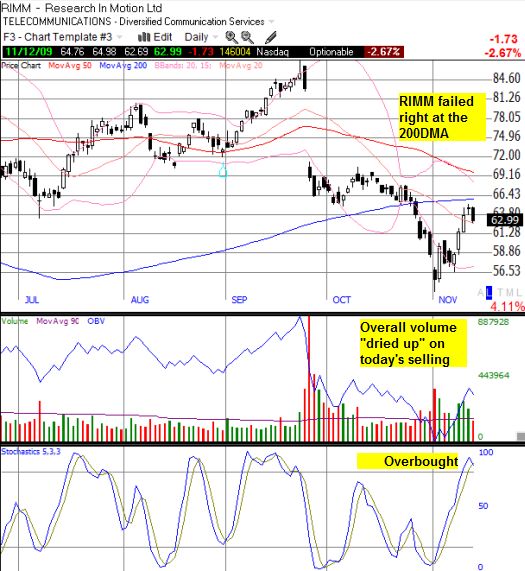
Thursday’s drop came at a critical technical juncture for RIMM. The stock is directly under its 200-day moving average (DMA) and stochastics are flashing an overbought signal (see chart below). Today, RIMM failed at this resistance, and, under “normal” conditions, would flag an entry for a short sale with a stop above the 200DMA. However, given a large buyer is likely lurking in the wings, such a short is more risky than usual, especially for holding overnight for a swing trade. The trading behavior in the first 30 minutes of trade might provide a serviceable criterion for initiating a trade for a day.

*Chart created using TeleChart:

Even if (when?) RIMM conquers the 200DMA, the pesky 50-day moving average looms directly overhead to serve as more trading resistance. Conquer that, and RIMM is right back in a bullish posture, positioned to close September’s disastrous earnings gap. Of course, RIMM management will buy shares independent of technical resistance and support levels, so it makes sense to take this trade one step at a time.
Be careful out there!
Full disclosure: no positions.

3 thoughts on “Potential Early Evidence of RIMM’s Share Repurchasing At Work”