We have all heard the claims that traders take the summer off, choosing to exchange their flashing computers for the calm, cool breezes of the beaches of the Hamptons, Martha’s Vineyard, etc… Yet, year after year, it has appeared to me that summers deliver plenty of noteworthy trading action. I finally decided to take a look at what the data say.
The data tell a slightly more complicated story: “sometimes” aggregate trading volume during the summer is light. Specifically, there have been two main periods since 1962 when summer trading volume was significantly lighter than the rest of the year: 1963-1976 and 1991-2001. This differential shrinks when comparing summer to just the first five months of the year.
I used monthly trading data on the S&P 500 from Yahoo!Finance for this review.
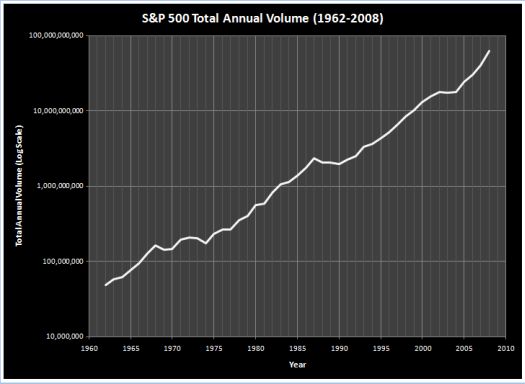
First, the total annual trading volume on the S&P 500 confirms what we would expect: a near constant and steady rise in overall trading volume every year. So, the pattern of monthly trading data should be independent of annual trading volume. (Chart is on log scale).

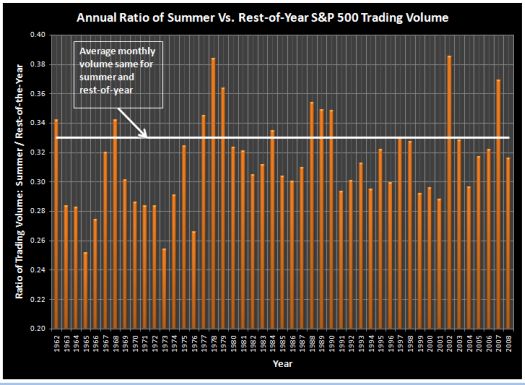
The monthly data reveals the relationship between summer and the remaining months of the year. The chart below compares aggregate summer trading volume, from June to August of each year, to the remaining months of the year by calculating a ratio between the two. The straight line represents the ratio at which average trading volume during the summer is equal to average trading volume for the rest of the year (3 months/9 months = .33).

We can immediately see that several years have had relatively massive trading volume over the summer: interestingly enough, 2002 featured the bottoming of the last bear market, 2007 featured the top of the last bull market. Since 2001, only summer 2004 can really be considered relatively light. (Of course, in 2001, 9/11 caused a tremendous surge in trading volume for the rest of the year).
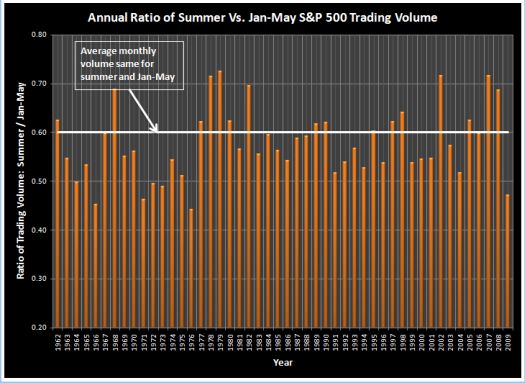
No matter how you look at these data, one cannot automatically assume that summer trading will be relatively light. This point is made even clearer when comparing summer just to the first five months of the year – January to May.

This chart shows the ratio of aggregate trading volume of the summer to January to May for each year. Again, the straight line represents the point where average monthly trading volume is equivalent between the two periods (3 months/5 months = 0.60). This time, I can include 2009. This summer’s trading volume has not been this light since 1976. Of course, the massive washout from January to March swamps the data. But notice that from 2005 to 2008, average summer trading volume was at least as high as the first five months of the year, and typically higher! One could argue that since 1977, we have experienced a noticeable increase in summer trading compared to the first five months of the year.
I can only assume that the old adage about light summer volume comes from trading veterans who have lived through many market cycles and selectively remember those periods when they themselves went on vacation rather than trade (=smile=). However, a review of the actual data since 1962, and particularly since 1977, should discourage us from automatically expecting relatively light trading summers every year.
Be careful out there!
Full disclosure: long SSO puts
