
The last Housing Market Review covered data reported in February, 2018 for January, 2018. At the time, I connected the dots on the bearish implications of converging technicals and fundamentals. The iShares US Home Construction ETF (ITB) actually managed to hold onto support at its 200-day moving average…until today. So not only is the seasonal trade on home builders busted, but also the home builder index has unfortunately confirmed a bearish turn in this trading cycle.
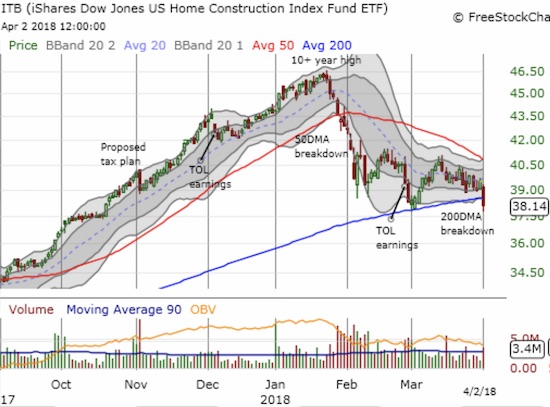
The broken 200DMA support (and declining 50DMA) means I will soon liquidate most of my remaining positions in home builders. I am not opening the escape hatch wide open because the housing data in February held steady. Moreover, I read through the latest earnings from KB Home (KBH) and found reasons for encouragement. Whenever my short-term read on the market turns bullish, KBH will likely be the only (new) home builder I buy.
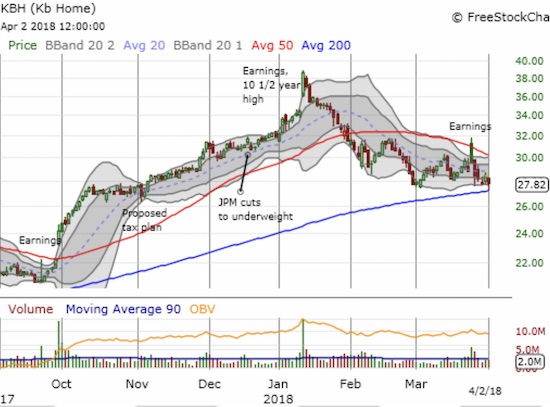
KBH reported strong earnings that the market quickly faded. The action has been quite a turn-around from the near parabolic euphoria that coincided with KBH’s January earnings report. KBH sold off so badly from a major gap that the stock erased the entire breakout from November. March earnings were initially greeted with a celebratory gap up, but sellers, perhaps learning lessons from January earnings, quickly scrambled for the exits. Today KBH lost 2.2% but managed to somehow hold its 200DMA support. I will cover KBH earnings in detail in another post.
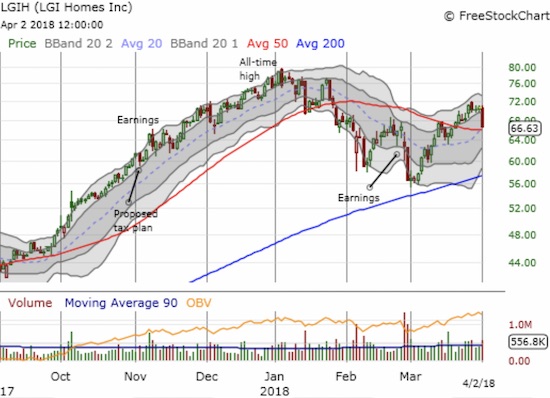
One home builder is still trying to cling to bullish territory: LGI Homes (LGIH). Recall that LGIH increased guidance during its February earnings report and still sold off sharply. Until today’s 5.6% whopping loss, LGIH looked like it had bullishly confirmed a 50DMA breakout. LGIH could become a major market tell.
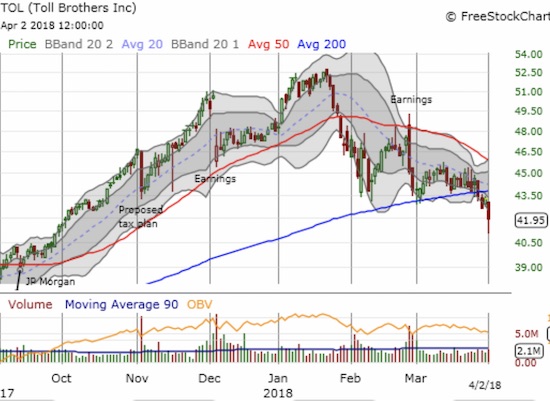
On the negative side, Toll Brothers (TOL) flashed a warning sign last week when it closed below its 200DMA support. Today’s 3.0% loss confirms the breakout AND confirms the major fade from February earnings.
Going forward, I have greatly tempered my expectations for the next few months during which home builders will finish limping through a period that is supposed to deliver relative strength against the S&P 500 (SPY).
New Residential Construction (Housing Starts) – February, 2018
Single-family housing starts for January were not revised and stayed at 877,000. February starts increased month-over-month by 2.9% to 902,000. On an annual basis, single-family housing starts increased 2.9%, representing the smallest annual gain since October, 2017 at 1.8%.
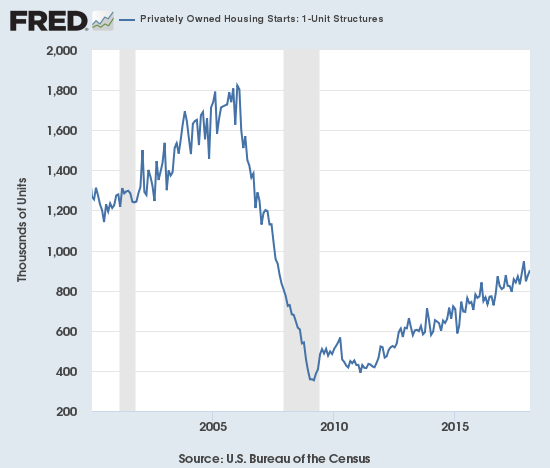
Source: US. Bureau of the Census, Privately Owned Housing Starts: 1-Unit Structures [HOUST1F], retrieved from FRED, Federal Reserve Bank of St. Louis, March 16, 2018.
Over the last six months, regional year-over-year changes in starts have exhibited wide dispersion. The Northeast, Midwest, South, and West each changed -4.5%, -36.8%, 8.7%, and 24.6% year-over-year respectively in February. The West delivered very strong growth once again as builders are clearly in a rush to serve a thirsting market. January’s 38.0% leap for the West was what I believe by far the largest year-over-year gain in housing starts for the region in a very long time.
Existing Home Sales – February, 2018
The existing home sales numbers for February, 2018 had a more favorable comparison than the previous month given a year ago sales took a steep dip off what was then a post-recession high. The end of a 2-month sales decline softens a bit the alarm bells from my previous Housing Market Review.
The routine description for existing sales is usually sales decline because of a shortage of inventory and sales increase in spite of inventory shortages. Sure enough, for February, the National Association of Realtors (NAR) started its report by saying: “Despite consistently low inventory levels and faster price growth, existing-home sales bounced back in February after two straight months of declines…” Still, the NAR attributed February’s sales gains to a “seasonal” jump in inventory. Recall that the NAR closed out 2017 by observing that sales could have been better if prices were not so high and inventory more available. Compare February’s statement to the frustrations expressed in January’s report:
“The utter lack of sufficient housing supply and its influence on higher home prices muted overall sales activity in much of the U.S. last month…The underproduction of single-family homes over the last decade has played a predominant role in the current inventory crisis that is weighing on affordability…”
The two-month decline in sales made the spike in November almost look like an anomaly. February’s rebound now makes November look more like the top of the next range in sales. The seasonally adjusted annualized sales of 5.54M were up 3.0% month-over-month from 5.38M in sales for January (no revisions). Year-over-year sales increased 1.0% but did not break the current trend of decelerating existing home sales.
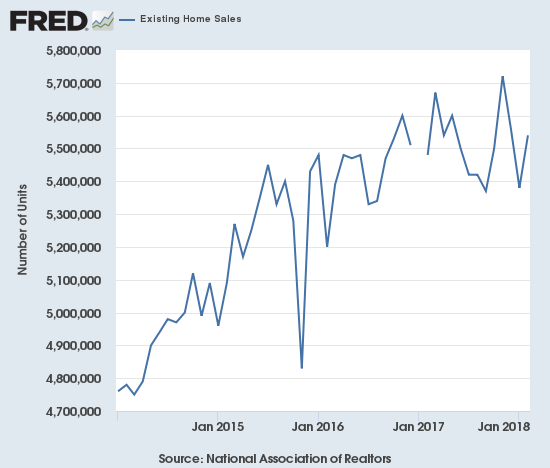
Source for charts: National Association of Realtors, Existing Home Sales© [EXHOSLUSM495S], retrieved from FRED, Federal Reserve Bank of St. Louis, April 1, 2018.
The share of sales going to first-time buyers stayed at 29%. This share was also 29% in November and was 31% a year ago. Recall that September was the first time in two years where the share dropped below 30%. The NAR warned that “Realtors® in several markets note that entry-level homes for first-timers are hard to come by, which is contributing to their underperforming share of overall sales to start the year.”
The average share for first-time homebuyers for 2016 was 35%. The NAR’s 2017 Profile of Home Buyers and Sellers reported an average of 34% for 2017. Investors purchased 15% of homes in February, down from 17% in January. Investor sales averaged a share of 15% in 2017 and 14% in 2016.
The absolute level of inventory of existing homes fell year-over-year for the 33rd straight month. Inventory increased from January to February by 4.6%, a second straight monthly increase. In the NAR’s previous press conference it noted that inventory “always” increases after the holidays. Again, the NAR attributed the monthly inventory increase to seasonal factors. Recall that during its June press conference, the NAR talked about a housing crisis in supply in some housing markets. The supply crisis continues to run deep at 3.4 months of supply at the current sales rate.
The 1.59M homes for sale represented a 8.1% decrease from the previous February. The string of year-over-year declines is remarkable: for example, starting from 2016…August -10.1%, September -6.8%, October -4.3%, November -9.3%, December -6.3%, January -7.1%, February -6.4%, March -6.6%, April -9.0%, May -8.4%, June -7.1%, July -9.0, August -6.5%, September -6.4%, October -10.2%, November -9.7%, December -10.3%, January -9.5%. These are the declines of an increasingly dysfunctional market that, as the NAR continues to imply, is driving prices to levels that will be hard to sustain without a dramatic improvement in the financial standing of potential home buyers.
For February, unseasonably cold and snowy weather hindered sales in the Northeast and the Midwest. The West and South made up the difference and then some: Northeast -7.2%, Midwest no change, South 3.4%, West 2%. As usual, regional sale fluctuations had no relationship to the on-going price run-ups. Indeed, inventory improvements did not prevent price hikes. All regions logged notable to substantial year-over-year jumps in their median price: Northeast 3.6%, Midwest 4.5%, South 5.4%, West 9.6%.
February’s 5.9% year-over-year increase in the overall median price of an existing home delivered the 72nd consecutive month of year-over-year increases. The median price of $241,700 is slightly up from January’s $240,500. The last record median price was set in August at $253,500.
Single-family sales increased 4.2% on a monthly basis and increased on a yearly basis by 1.8%. The median price of $243,400 was up 5.9% year-over-year.
The NAR did not provide an update on the (apparent) impact of tax reform on existing home sales.
New Residential Sales – February, 2018
New single-family home sales in November essentially confirmed a tremendous resurgence in new home sales that was synchronized with a resurgence of existing home sales. Similar to existing home sales, new home sales dropped sharply from November’s high level. For February, new home sales barely eked forward.
The Census Bureau revised January sales of new single-family homes significantly upward from 593,000 to 622,000. This revision switches January’s year-over-year decline of 1.0% to a GAIN of 3.8%. New home sales for February decreased 0.6% month-over-month and increased 0.5% year-over-year to 618,000. Year-over-year gains have regularly hit double digits since 2012; November’s 26.6% jump was the highest since February, 2015 when new home sales soared 29.8% year-over-year. So the low single-digit gains of the last two months are notably disappointing. Moreover, the uptrend from the trough no longer looks solid. In the coming months, I will continue looking for signs that new home sales have stalled out.
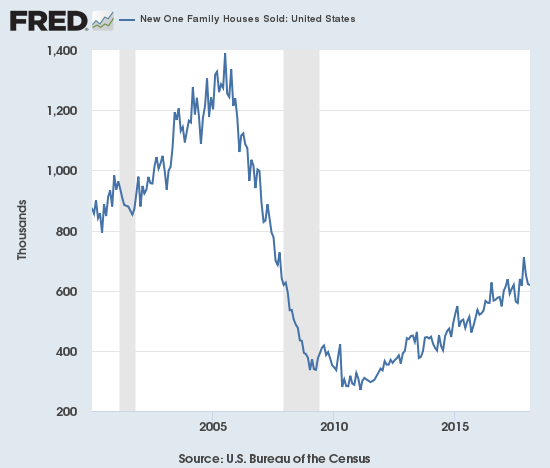
Source: US. Bureau of the Census, New One Family Houses Sold: United States [HSN1F], retrieved from FRED, Federal Reserve Bank of St. Louis, April 1, 2018.
In September, new home sales were strong enough to plunge inventory from 6.1 months of supply to 5.0 months. October’s inventory slipped slightly to 4.9 months of supply. The exceptionally strong sales volume of November pushed inventory to 4.6 months of supply. December’s pullback sent inventory jumping back to 5.7 months of supply. A market for homes is in balance at 6 months of supply, so the market’s recent unbalance came to an abrupt end in December. February’s inventory stood at 5.9 months.
Because new home sales jumped in October, I was surprised that the median price of a new home actually fell 3.3% from September. For November, the median fell slightly from October to $318,700, a 1.2% year-over-year gain. In December, the median price jumped to $335,400, a 2.4% year-over-year gain. January’s median price of $323,000 was a decline from December but still a 2.5% year-over-year gain. February’s median price of $326,800 is a year-over-year surge of 9.7%. The average price declined 1.6% so there was clearly a relative jump in lower-priced homes.
On a regional basis, new home sales were divergent again. After a string of very strong gains since August, the Northeast finally ran out of gas in January with a 44.2% year-over-year plunge. For February the Northeast returned to gains with an 8.8% jump. The Midwest decreased 8.1%. The South eked out a 0.6% year-over-year gain. The West cooled off from January’s blistering 33.2% year-over-year gain to gain 3.1% year-over-year for February.
Home Builder Confidence: The Housing Market Index – March, 2018
If not for the previous month’s dour set of data, I would not have thought much of March’s slight decline in the Housing Market Index (HMI). Even at 70, the HMI is still higher than it was for most of 2017. Still, I could not help notice that one of the components is diverging sharply from the others. The Traffic of Prospective Buyers dropped from 54 to 51 and reversed all its gains since November, 2017. The other two components have stalled a bit, but both are well above their low points in November. This could be an early sign of waning demand right in the middle of the important Spring selling season. This kind of dip last happened three years ago, but all three components moved together. I am on alert.
The NAHB was optimistic as usual. Leaning on the fundamentals of a strong economy, the NAHB caveated its concerns:
“…builders are reporting challenges in finding buildable lots, which could limit their ability to meet this demand. Managing construction costs and future sales prices will be a key challenge in medium-term as costs associated with both land development and home construction continue to increase.”
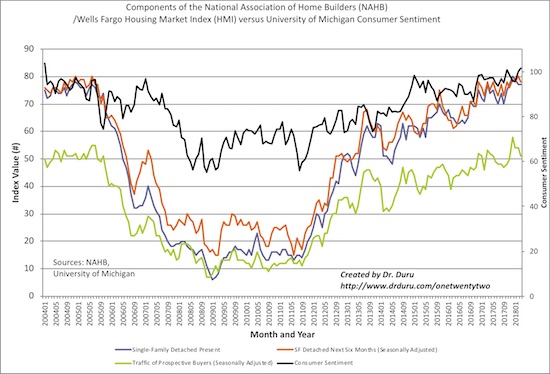
Source: NAHB
The drop in the HMI is a little less ominous given the entirety of the loss came from the Midwest region. The other three regions each increased from February to March. The Northeast and the South each gained one point while the West gained two.
Parting thoughts
While I wring my hands about a worsening picture for the housing market and home builders, California still stands out as a bastion of strength. The NAR cited 5 metros at the top of its list for growth: Californian regions were four of these metropolitan areas. Housing starts are running at a blistering pace in California to keep up with the demand. Still, the construction activity remains insufficient. For example, State Senator Scott Wiener is pushing an aggressive housing bill that would tightly constrain the ability of cities to reject housing developments.
Wiener’s bill gives “…the state more power over land use within a half-mile of major transit stops or a quarter-mile of bus lines to create a more developer-friendly environment for new housing.” It “…would establish a uniform statewide standard for housing in transit-rich zones and prevent cities from blocking construction of new multifamily apartment buildings based on height or density.” It is a bold plan that is meeting timid response from Californian Democratic candidates for governor and outright opposition from the Republican candidates. Not surprisingly, local communities are speaking up against the bill.
The bill is part of many efforts to solve a growing crisis of housing availability and affordability in the state. California suffers from a classic problem of communities shutting the door to new growth for the sake of insulating existing residents. Meanwhile a booming economy continues bringing new workers who put more and more strain on the tightly constrained housing supply. Something has to give. California could either be the gunk the slows down the growth of home builders OR it could be the floodgate that keeps business booming for years to come. This quote from KB Homes’ conference call (transcript from Seeking Alpha) says it all:
“…we’re less than half of what we once were. You’ve seen a lot of the media coverage on the housing shortage in the state.
The governor and a lot of the mayors have put a stake in the ground that they’re going to increase units built by 100,000 a year. I don’t know how they’d do it, but we’d love to see it and help them get there. It’s our backyard and it’s where we have our most seasoned teams. So, we’re nowhere near close to saturation in this state. I think we could double from where we are today, and we’d still have upside.”
Be careful out there!
Full disclosure: long TOL calls, long ITB calls
I work for a production builder in Michigan and we build roughly 700 homes a year. For some reason Febuary was a rough month for sales but at the same time we have a back log of homes that will take us out to the beginning of next year. Speaking to our sales team this week, I have been informed that many of them have had a very strong end of the month.
I too am a bit weary of the techinical charts of home builder stocks, but I think this will be short lived. My company still feels good about the housing sector and is posting record margins. I like companies like TOL, WY and UFPI. I’m mostly focused on stocks that supply building materials, because although the housing market might be flat the past couple months my company keeps building houses to meet the growing demand.
Hi Ryan.
Thanks for the additional insight! Stocks in this industry are given very little slack as investors and traders in this space are always trying to (over)anticipate the next housing downturn. I haven’t looked enough at the materials companies, and was discouraged last week when I saw some major materials companies break down technically.
I will stay vigilant. As I noted in my piece, I read nothing but strength in KBH earnings. LGIH guided UP. So there SHOULD be opportunity ahead whenever market sentiment heals up.
— Duru