
AT40 = 27.3% of stocks are trading above their respective 40-day moving averages (DMAs)
AT200 = 36.2% of stocks are trading above their respective 200DMAs (new 2-year closing and intraday lows)
VIX = 23.6
Short-term Trading Call: neutral
Commentary
In my last Above the 40, I tried to highlight the positives even as the negatives in the market grew. Sellers saw fit to remove one more positive: AT40 (T2108), the percentage of stocks trading above their respective 40-day moving averages (DMAs), effectively ended the pattern of higher lows with an intraday which tested the last low. Piling on, AT200 (T2107), the percentage of stocks trading above their respective 200-day moving averages (DMAs), set new 2-year lows at its intraday low and its close. So more and more stocks are suffering major breakdowns of long-term uptrends.
Perhaps even more importantly, the S&P 500 (SPY) lost 2.2% and closed below support at its 200-day moving average (DMA) for the first time since June 27, 2016 in the immediate wake of Brexit. That episode lasted one day. The 200DMA was retested in picture-perfect form on November 5, 2016 just ahead of the U.S. Presidential election.
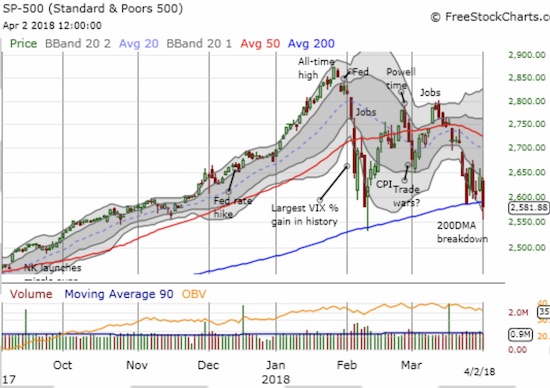
The S&P 500 is down 10.1% from its all-time high and is down 3.4% year-to-date. Today’s 2.2% loss was the S&P 500’s worst start to an April since at least 1950; the index lost 1.6% in 1986. Given the importance of the S&P 500’s two months of weakness, I am surprised to see that the index’s 200DMA is STILL trending upward. This strength is a testament to the near relentless upward momentum from 2017 that carried into January of this year. Over the last three years, I developed a topping signal based on the 200DMA logging a loss over 5 days after an all-time high. The S&P 500 has yet to experience such a stretch since its last all-time high. If the index fails to turn around its momentum in the coming weeks, this signal could become the straw that breaks me down into the bearish camp. Stay tuned on that one.
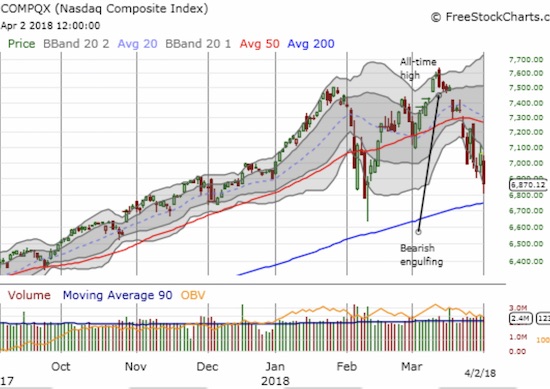
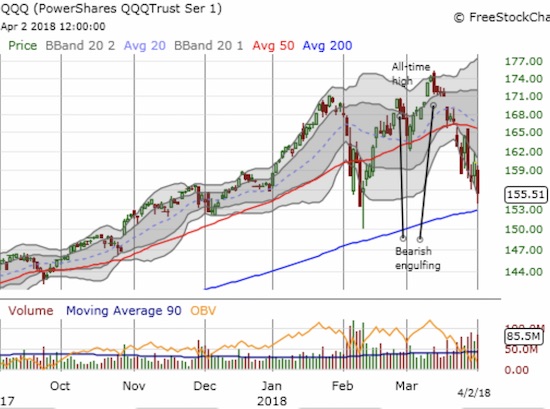
Tech stocks weighed heaviest on the market with the NASDAQ dropping 2.7% and the PowerShares QQQ ETF (QQQ) losing even more at 2.9%. As I feared was coming, a test of 200DMA support is in play; this push is helping to drag down the rest of the market.
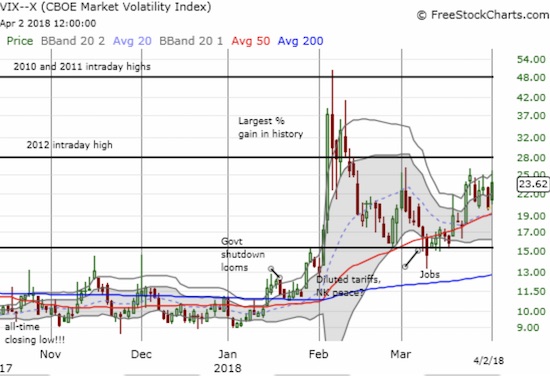
Given the latest carnage in the market, I am a bit surprised the volatility index, the VIX, did not gain a lot more. Instead, the VIX challenged the March high and fell back to end the day with an 18.3% gain.
I am now officially on watch for oversold trading conditions (AT40 below 20%). Assuming oversold comes, it will likely happen just as the tech indices test 200DMA support. Alongside that drama will come sellers following through on the S&P 500’s bearish breakdown. My aggressiveness for buying oversold conditions will increase roughly proportional to the spike the market delivers in the VIX. In the meantime, I decided to go ahead and buy some SPY call options expiring at the end of next week alongside a put option on Boeing (BA) expiring this week.
CHART REVIEWS
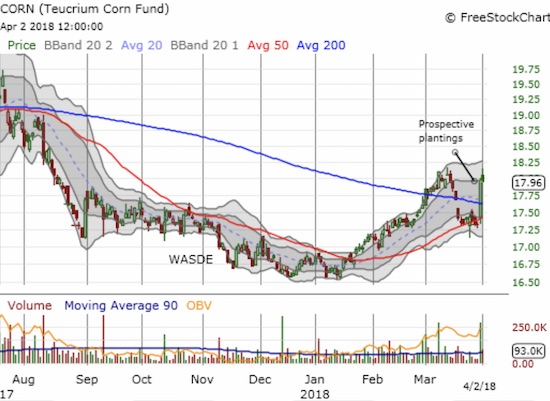
Teucrium Corn ETF (CORN)
The U.S. Department of Agriculture (USDA) forecast lower corn plantings that surprised markets. The news sent corn prices soaring and CORN benefited. I managed to MISS this great move as twice ahead of this surge I low-balled my offer by nickels. If I had fully appreciated the potential for this crop report, I would have made sure to get a position in place. Another one of those lessons learned!
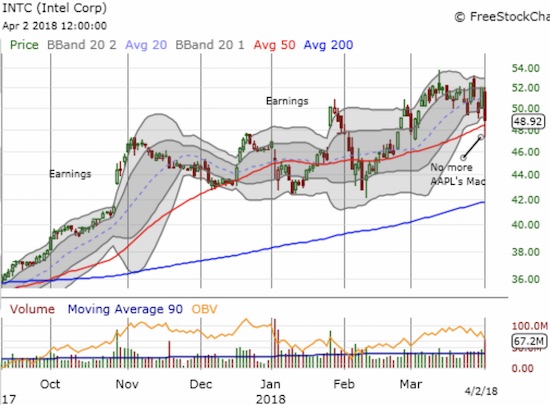
Intel (INTC)
Sellers walloped INTC as much as 9.2% on the heels of news/rumors that Apple (AAPL) planned to drop Intel chips from its Macs. According to Bloomberg, AAPL represents 5% of INTC revenue. Without knowing the share of growth, I cannot decisively say that the sell-off was overdone, but I strongly suspect it was. Still, the news combined with the market’s reaction is enough to keep me from treating this as another golden opportunity to buy a dip in INTC between earnings. Instead, I set up a hedged trade of calls and puts expiring this week on the assumption that the stock will make at least one more sharp move in the next few days as the market digests the implications of this news and whatever official statements accompany the drama.
Other trades related to previous posts: N/A
— – —
FOLLOW Dr. Duru’s commentary on financial markets via email, StockTwits, Twitter, and even Instagram!
“Above the 40” uses the percentage of stocks trading above their respective 40-day moving averages (DMAs) to assess the technical health of the stock market and to identify extremes in market sentiment that are likely to reverse. Abbreviated as AT40, Above the 40 is an alternative label for “T2108” which was created by Worden. Learn more about T2108 on my T2108 Resource Page. AT200, or T2107, measures the percentage of stocks trading above their respective 200DMAs.
Active AT40 (T2108) periods: Day #31 over 20% (overperiod), Day #1 under 30% (underperiod ending 4 days over 30%), Day #7 under 40%, Day #14 under 50%, Day #39 under 60%, Day #45 under 70%
Daily AT40 (T2108)
")
Black line: AT40 (T2108) (% measured on the right)
Red line: Overbought threshold (70%); Blue line: Oversold threshold (20%)
Weekly AT40 (T2108)

*All charts created using freestockcharts.com unless otherwise stated
The charts above are my LATEST updates independent of the date of this given AT40 post. For my latest AT40 post click here.
Related links:
The AT40 (T2108) Resource Page
You can follow real-time T2108 commentary on twitter using the #T2108 or #AT40 hashtags. T2108-related trades and other trades are occasionally posted on twitter using the #120trade hashtag.
Be careful out there!
Additional disclosure: long SPY shares and calls, long INTC calls and puts, long CORN, long BA put
*Charting notes: FreeStockCharts.com uses midnight U.S. Eastern time as the close for currencies. Stock prices are not adjusted for dividends.