
AT40 = 66.3% of stocks are trading above their respective 40-day moving averages (DMAs) – Day #1 of an overbought period
AT200 = 63.6% of stocks are trading above their respective 200DMAs
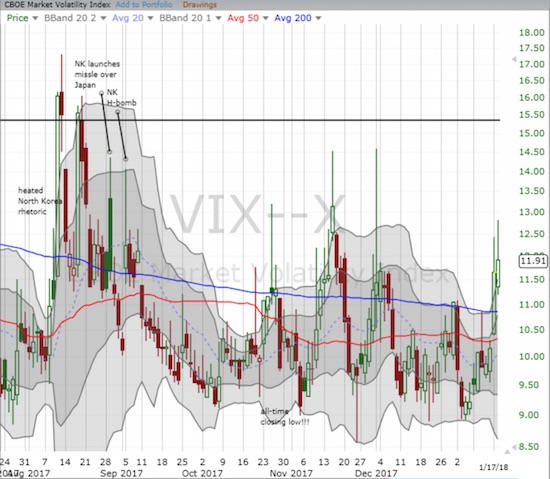
VIX = 11.9
Short-term Trading Call: bullish
Commentary
The S&P 500 (SPY) made a resounding comeback from the previous day’s reversal. The move validated my insistence on leaving the short-term trading call on bullish.
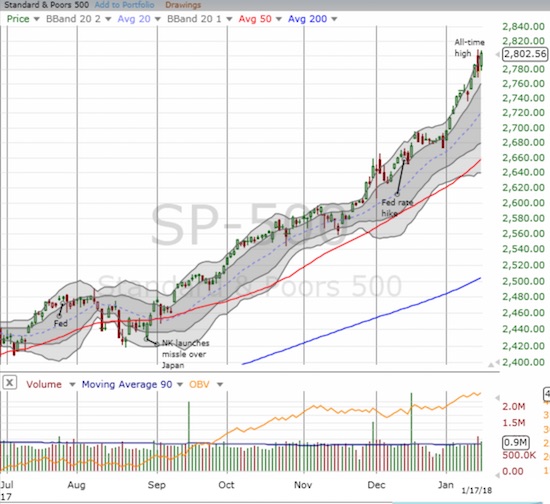
However, while the S&P 500 made another all-time high, AT40, the percentage of stocks trading above their respective 40-day moving averages (DMAs), did NOT return to overbought territory or even make much of a dent in the previous day’s loss. In other words, the S&P 500 comeback left a bunch of stragglers behind. Those laggards narrowed the breadth of the advance. AT40 only made it back to 66.3%. AT200 (T2107), the percentage of stocks trading above their respective 200DMAs, did not even muster a full percentage point gain.
The volatility index, the VIX, added to the intrigue. Despite a strong rally day, the VIX managed to gain 2.1% even as volatility faders took the VIX well off its high of the day. The VIX has now gained 8 out of the 9 last trading days. This move somehow failed to help ProShares Ultra VIX Short-Term Futures (UVXY) which lost 4.3%. I fought off the disappointment and decided to hold my UVXY calls one more day since it seems the VIX’s advance is still not over yet.
Note that over the last 9 trading days, the VIX has gained 30.1% while UVXY has only eked out a 3.2% gain. In fact, UVXY has traded DOWN 6 of the last 9 trading days. Obviously, this is NOT the kind of performance I expect out of my hedge. I am at a loss to explain the persistent and wide under-performance. Is something going catastrophically wrong with UVXY’s management of VIX futures? The iPath S&P 500 VIX ST Futures ETN (VXX) similarly under-performed, and ProShares Short VIX Short-Term Futures (SVXY) GAINED 2.4%!
So while the price action on the major indices was very bullish, the latest buyer’s stampede left some curious signals in its dust. The contrary performance of AT40 and the VIX has me on alert for *some* catalyst to emerge to spike the VIX much higher in coming days. Note that I expect a relatively large spike in the VIX to get faded just as sharply as other spikes in recent years.
STOCK CHART REVIEWS
It was easy to find conflicting signals in individual stocks.
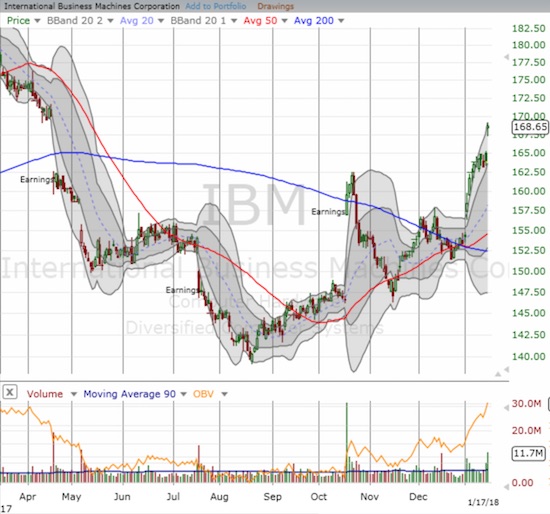
International Business Machines (IBM)
IBM gapped higher for a 2.9% gain and almost filled the post-earnings gap down from last April.
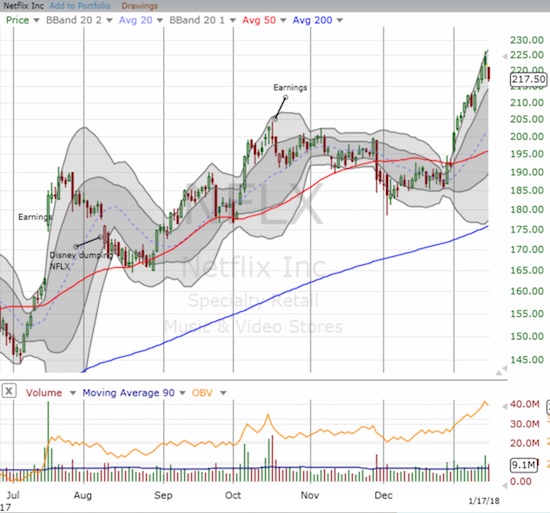
Netflix (NFLX)
NFLX held onto a slim gain on Tuesday. Today it lost 1.8% despite the market’s rally. The trading action looks toppy, but the stock will need to fall out of its upward trending trading channel to confirm any bearish implications.
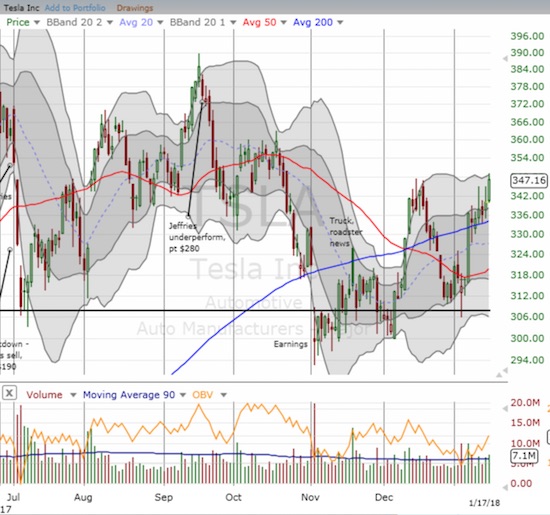
Tesla (TSLA)
TSLA is a great tell for speculative fever in the market. The stock gained a healthy 2.1% and notched a near 3-month high.
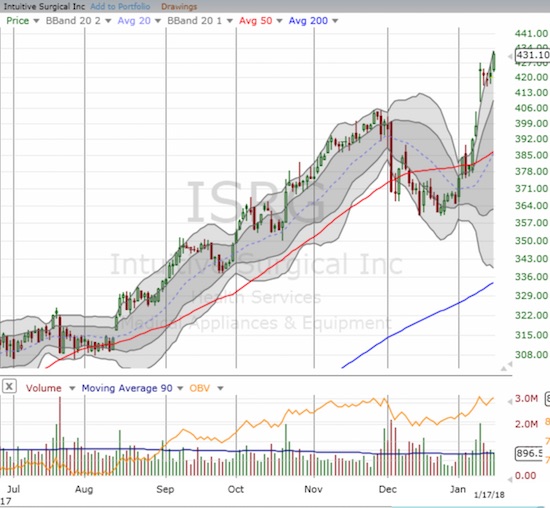
Intuitive Surgical (ISRG)
ISRG hit another all-time high. The stock is up an astounding 18.1% already in the new year. IBM who?
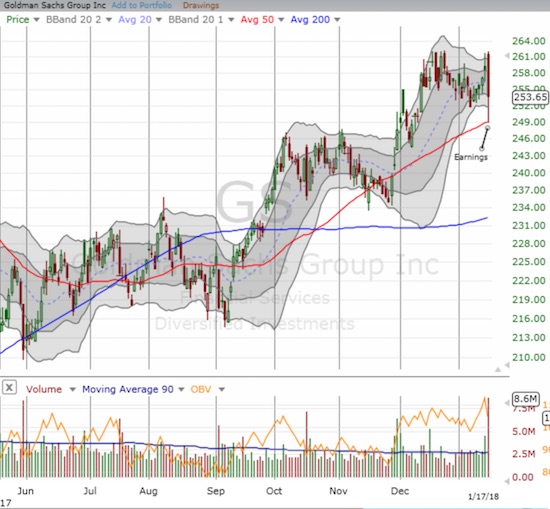
Goldman Sachs (GS)
The Financial Select Sector SPDR ETF (XLF) gained 0.8% on the day, but GS stumbled to a 1.9% loss on a poor post-earnings response. I have learned to take a swing at GS when it dips post-earnings. This opportunity was too good to pass up with the picture-perfect bounce off 50DMA support. I am looking for GS to at least recover this loss in the coming days or weeks.
In other trading action, NVIDIA (NVDA) hit my buy trigger when it hit the lower edge of its upper-Bollinger Band (BB) channel on Tuesday. I sold my call options on today’s rally for a respectable 50%+ gain.
— – —
FOLLOW Dr. Duru’s commentary on financial markets via email, StockTwits, Twitter, and even Instagram!
“Above the 40” uses the percentage of stocks trading above their respective 40-day moving averages (DMAs) to assess the technical health of the stock market and to identify extremes in market sentiment that are likely to reverse. Abbreviated as AT40, Above the 40 is an alternative label for “T2108” which was created by Worden. Learn more about T2108 on my T2108 Resource Page. AT200, or T2107, measures the percentage of stocks trading above their respective 200DMAs.
Active AT40 (T2108) periods: Day #474 over 20%, Day #288 over 30%, Day #88 over 40%, Day #36 over 50%, Day #27 over 60%, Day #1 over 70% (overbought period ended 61 days below 70%)
Daily AT40 (T2108)
")
Black line: AT40 (T2108) (% measured on the right)
Red line: Overbought threshold (70%); Blue line: Oversold threshold (20%)
Weekly AT40 (T2108)

*All charts created using freestockcharts.com unless otherwise stated
The charts above are my LATEST updates independent of the date of this given AT40 post. For my latest AT40 post click here.
Related links:
The T2108 Resource Page
You can follow real-time T2108 commentary on twitter using the #T2108 or #AT40 hashtags. T2108-related trades and other trades are occasionally posted on twitter using the #120trade hashtag.
Be careful out there!
Full disclosure: long UVXY calls, long GS calls
*Charting notes: FreeStockCharts.com uses midnight U.S. Eastern time as the close for currencies. Stock prices are not adjusted for dividends.
A wild guess at the UVXY–$VIX disconnect is volatility expectations finally flipping from backwardation to contango.
Something going awry with the futures has to explain it….