
(T2108 measures the percentage of stocks trading above their respective 40-day moving averages [DMAs]. It helps to identify extremes in market sentiment that are likely to reverse. To learn more about it, see my T2108 Resource Page. You can follow real-time T2108 commentary on twitter using the #T2108 hashtag. T2108-related trades and other trades are occasionally posted on twitter using the #120trade hashtag. T2107 measures the percentage of stocks trading above their respective 200DMAs)
T2108 Status: 9.3%
T2107 Status: 12.9% (a fresh near 7-year closing low)
VIX Status: 26.1% (high of the day was 27.6, right under the 2012 intraday high
General (Short-term) Trading Call: bullish
Active T2108 periods: Day #8 under 20%, Day #11 under 30%, Day #27 under 40%, Day #31 below 50%, Day #46 under 60%, Day #387 under 70%
Commentary
T2108 closed at 9.3% on day #8 of this oversold period. Traders positioning for the next (relief) rally have been holding their collective noses for a third day now as the trading action continues to stink – to use a technical term. Three out of the last four trading days have ended with T2108 in single digits. Using the historical data I laid out last week, this scenario suggests that this oversold period could reach for a 15-day span…just in time for the next meeting of the Federal Reserve.
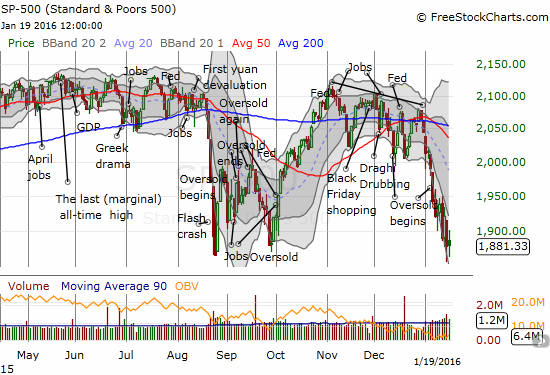
While T2108 closed with a marginal gain, the S&P 500 (SPY) struggled mightily to close flat for the day. I am not calling this a bullish divergence because the change in T2108 is so small relative to the size of this bearish trading action.
As the reality of an extended oversold period has sunk into my consciousness, I pulled the trigger on precious few trades. So now comes the time for waiting: I am waiting for a signal from the volatility index, the VIX. The last element of the T2108 trading rules is to make a move once volatility “spikes.” Given my current aggressive positioning, it makes little sense to continue accumulating until the nature of trading changes in my favor. A spike in the VIX could and should signal the imminent end of this oversold period.
I now define a spike as a move well above the upper-Bollinger Band. The VIX put on such a show during the flash crash of the August Angst. It is a moment when panic and fear ramp to climax levels; the ultimate peak of seller’s exhaustion. I like to buy into such spikes; more conservative traders can wait until the VIX completely reverses the gains from the spike and start accumulating from there. (Note that during the August Angst, the S&P 500 still soon retested its lows after the volatility spike completely reversed).
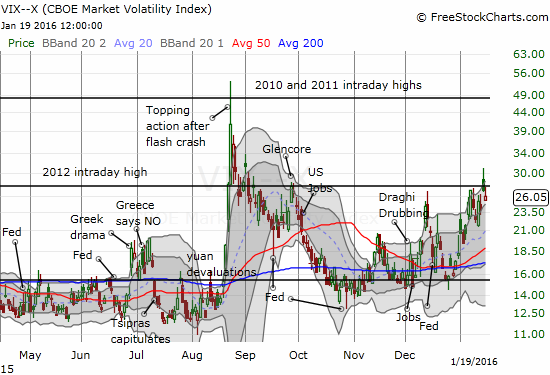
Incredibly, despite all this persistently bearish trading action, the VIX STILL cannot crack resistance from the intraday high from 2012. This loitering around such an important resistance level makes the VIX start to look like a coiled spring. So now I wait…
As promised, I wrote an update to “How The S&P 500’s Current Breakdown Increases The Odds Of Further Selling.” I called it “The S&P 500’s Latest Breakdown Echoes The Warning Signal From The August Angst.” Basically, if current support on the S&P 500 cannot hold firm, the “200DMA signal” suggests we could be in for a 2000 or 2008 magnitude sell-off albeit dragged out over time. Interestingly, Jim Cramer made the same argument tonight on Mad Money using the work of famed Fibonacci technician Carolyn Boroden. Similarly, she agrees with T2108 technicals that an oversold bounce of notable size appears imminent. This is some SERIOUS bear/bull tension!
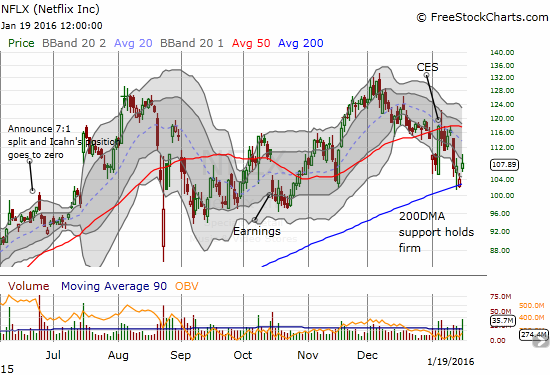
After-hours brought a shred of positive news with Netflix (NFLX) managing to tack on another 7.2% on top of the 3.7% gain in the regular session. All eyes will likely be on NFLX’s post-earnings trading action. The stock’s ability to hold support at its 200-day moving average (DMA) and then hold post-earnings gains would be baby steps in the right direction. However, NFLX’s relative strength has meant that NFLX’s good fortunes have not necessarily translated into the fortunes of the masses. Needless to say, if NFLX manages to close below 200DMA support, such a move would add yet more anchors to bearish sentiment.
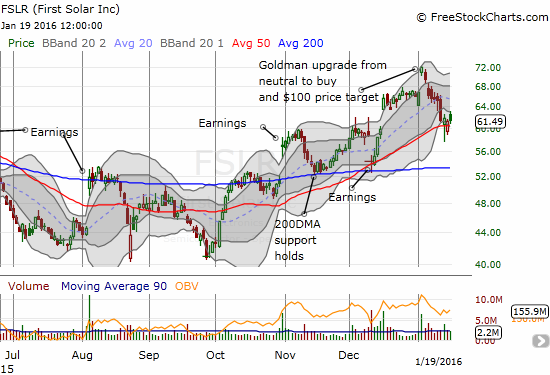
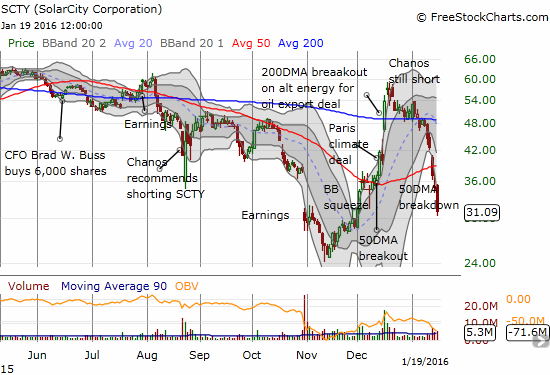
One sector in dire need of a return to cheer is the solar sector. Late last year, I admired the select bullish setups in solar stocks. Now, First Solar (FSLR) is just about the last one left standing without a fresh breakdown. I contrast FSLR with Solar City (SCTY) as an example of the sharp divergences.
Finally, I neglected to acknowledge the bankruptcy of Arch Coal (ACI) last week. That final collapse brought a merciful end to the trade I described at the beginning of December as “A ‘Last Chance’ Trade on Arch Coal.” A title never rang so true! Fortunately, per my typical approach, I used call options and not shares. I am now curious to hear what Soros has to say about this turn of events. His massive bet on the company earlier in 2015 gave coal stocks one last gasp of hope.
— – —
For readers interested in reviewing my trading rules for T2108, please see my post in the wake of the August Angst, “How To Profit From An EPIC Oversold Period“, and/or review my T2108 Resource Page.
Reference Charts (click for view of last 6 months from Stockcharts.com):
S&P 500 or SPY
U.S. Dollar Index (U.S. dollar)
EEM (iShares MSCI Emerging Markets)
VIX (volatility index)
VXX (iPath S&P 500 VIX Short-Term Futures ETN)
EWG (iShares MSCI Germany Index Fund)
CAT (Caterpillar).
IBB (iShares Nasdaq Biotechnology).
Daily T2108 vs the S&P 500
")
Black line: T2108 (measured on the right); Green line: S&P 500 (for comparative purposes)
Red line: T2108 Overbought (70%); Blue line: T2108 Oversold (20%)
Weekly T2108

*All charts created using freestockcharts.com unless otherwise stated
The charts above are the my LATEST updates independent of the date of this given T2108 post. For my latest T2108 post click here.
Related links:
The T2108 Resource Page
Expanded daily chart of T2108 versus the S&P 500
Expanded weekly chart of T2108
Be careful out there!
Full disclosure: long SVXY shares, long and short UVXY put options, long SSO call options, long SSO shares, short, long SCTY, long FSLR call options
Did we actually get down to mid-single digits intraday on T2108?
This really looks to me to be like the fall 2011 decline. We are not in a recession, and the market was not in a euphoric blowoff prior to the downturn. The only reason is the drop in oil, which on the surface doesn’t seem like it will torpedo every industry around. Actually, it’s good for many.
We had a decent close off the lows, but probably it’s going lower before we get a bounce. After that, I would still expect a retest. For long term investors, that retest, if it happens, could be a helluva opportunity.
The VIX did spike up today, but not to 40 or thereabouts. Still room for fear, so that’s why I’m thinking it will go lower.
I am working on my next post that should answer your question. The big difference with this sell-off from 2011 is that it was preceded by another major sell-off that had its own quirky and intense oversold behavior. Combined, these two major sell-offs have the feel of something bigger. However, I agree that long-term investors SHOULD be buying *something* here…after all, a long-term orientation teaches you to have optimism in the future and faith that in due time the market will resume an uptrend.