
(T2108 measures the percentage of stocks trading above their respective 40-day moving averages [DMAs]. It helps to identify extremes in market sentiment that are likely to reverse. To learn more about it, see my T2108 Resource Page. You can follow real-time T2108 commentary on twitter using the #T2108 hashtag. T2108-related trades and other trades are occasionally posted on twitter using the #120trade hashtag. T2107 measures the percentage of stocks trading above their respective 200DMAs)
T2108 Status: 25.7%
T2107 Status: 26.7%
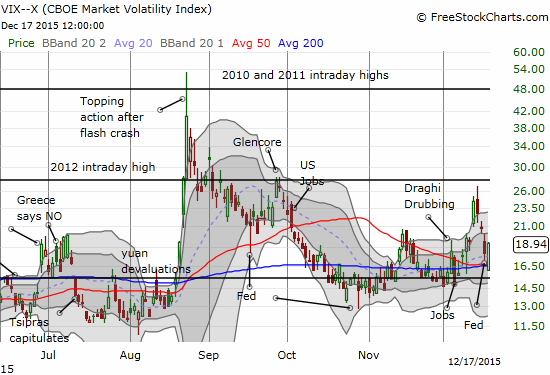
VIX Status: 18.9
General (Short-term) Trading Call: bullish – see below for caveats
Active T2108 periods: Day #3 over 20%, Day #6 under 30%, Day #7 under 40%, Day #11 below 50%, Day #26 under 60%, Day #367 under 70%
Reference Charts (click for view of last 6 months from Stockcharts.com):
S&P 500 or SPY
SDS (ProShares UltraShort S&P500)
U.S. Dollar Index (volatility index)
EEM (iShares MSCI Emerging Markets)
VIX (volatility index)
VXX (iPath S&P 500 VIX Short-Term Futures ETN)
EWG (iShares MSCI Germany Index Fund)
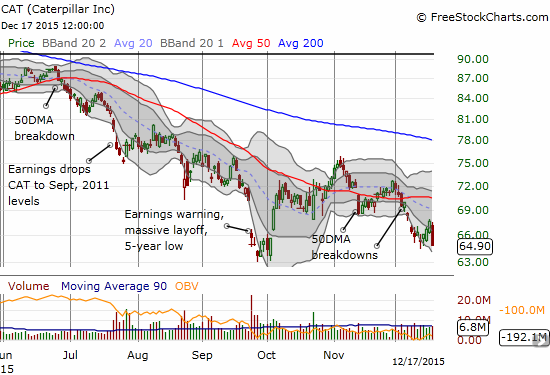
CAT (Caterpillar).
IBB (iShares Nasdaq Biotechnology).
Commentary
In the last T2108 Update, I wowed over the “power move” by the S&P 500 (SPY). Fortunately, I resisted the natural temptation to declare the start of a new rally. Today’s “reverse power move” reminded me that this is still a market with deteriorating underlying technicals. The complete reversal of the S&P 500 that closed it right back under 50 and 200DMA resistance was the most disappointing part of the action.
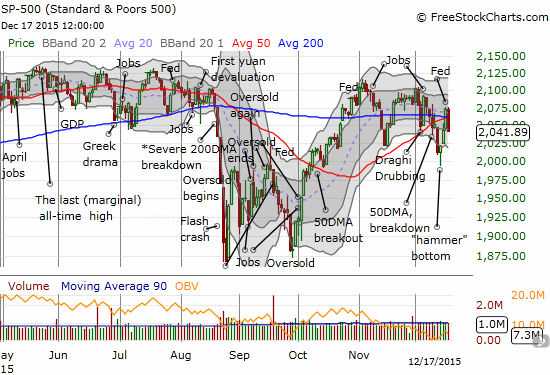
T2108 closed at 25.7%. Now the percentage of stocks trading above their respective 40-day moving averages (DMAs) is right back in sniffing distance of oversold trading conditions. However, T2108 did NOT reverse all its previous gains. This is good news because it is a rare day where the selling was a little more selective. In previous declines, the S&P 500 has proven relatively resilient while T2108 made outsized losses. This sliver of good news will matter little once/if T2108 drops back into oversold territory. The T2108 trading rules will still apply. For now, I am assuming the December (intraday) low will hold for this month.
The volatility index jumped 6.1%. The VIX has good news similar to T2108: the index did not reverse all its losses from the previous day. However, like T2108, I do not think this will matter much if/when the VIX crosses an important threshold: above 20 is “elevated” and above the previous intraday high (26.8) will trigger buys and anti-volatility trades.
I have not covered Caterpillar (CAT) in a while. Long-time readers know that I like shorting CAT to hedge bullishness. This time around, I did not think to refresh a short position on CAT. The stock suffered very telling losses. CAT gapped down on its way to a huge 4.2% drop which reversed THREE days of gains in one swoop. The close is a new 2+ month low.
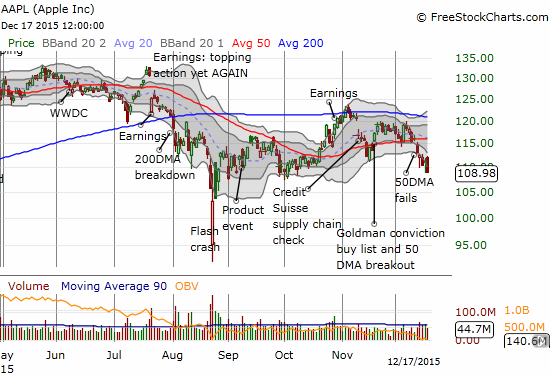
At the risk of sounding like a broken record, Apple (AAPL) is another major stock shouting out bearish alarms. Like CAT, AAPL printed a fresh 2+ month closing low. Unlike CAT, I immediately thought to fade AAPL once I noticed the weakening at the open. I flipped put options for a 134% gain and actually still sold too early. It always pains me to trade against AAPL, but the chart says it all to me…and these technicals are bad news for the market in general.
Finally, the Australian dollar has once again turned south on a dime. AUD/JPY in particular has struggled to make a bullish break above 50DMA resistance. My favorite proxy of sentiment on risk is flashing yellow. A break of the last low (from the last 50DMA breakdown) turns the flashing back to red.
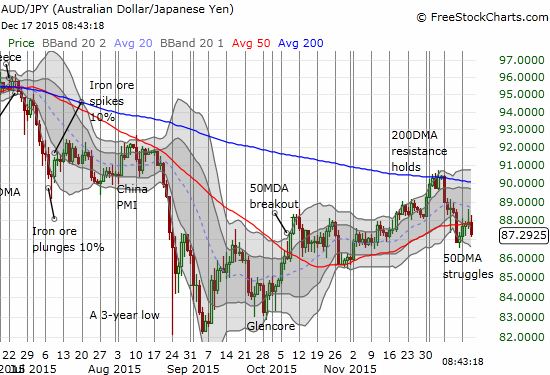
Speculators have supported the recent rally in the Australian dollar. Net short positions have contracted significantly in recent weeks. To me, this positioning means that the market has recharged its capacity for selling the Australian dollar anew in the future. I remain stubbornly net short.

Source: Oanda’s CFTC’s Commitments of Traders
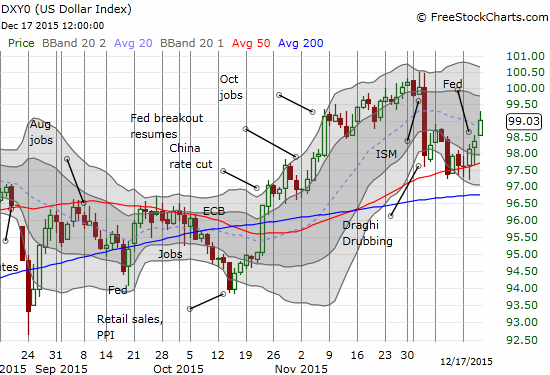
And my stubborn bullishness on the U.S. dollar is being rewarded…
Daily T2108 vs the S&P 500
")
Black line: T2108 (measured on the right); Green line: S&P 500 (for comparative purposes)
Red line: T2108 Overbought (70%); Blue line: T2108 Oversold (20%)
Weekly T2108

*All charts created using freestockcharts.com unless otherwise stated
The charts above are the my LATEST updates independent of the date of this given T2108 post. For my latest T2108 post click here.
Related links:
The T2108 Resource Page
Expanded daily chart of T2108 versus the S&P 500
Expanded weekly chart of T2108
Be careful out there!
Full disclosure: net short the Australian dollar, net long the U.S. dollar