
(T2108 measures the percentage of stocks trading above their respective 40-day moving averages [DMAs]. It helps to identify extremes in market sentiment that are likely to reverse. To learn more about it, see my T2108 Resource Page. You can follow real-time T2108 commentary on twitter using the #T2108 hashtag. T2108-related trades and other trades are occasionally posted on twitter using the #120trade hashtag. T2107 measures the percentage of stocks trading above their respective 200DMAs)
T2108 Status: 30.0%
T2107 Status: 28.6%
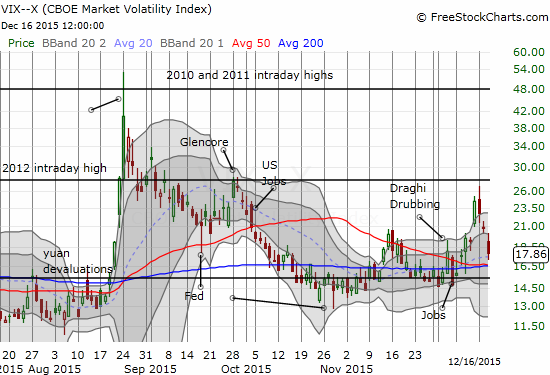
VIX Status: 17.9
General (Short-term) Trading Call: bullish
Active T2108 periods: Day #2 over 20%, Day #5 under 30% (day 5 AT 29.98%), Day #6 under 40%, Day #10 below 50%, Day #25 under 60%, Day #366 under 70%
Reference Charts (click for view of last 6 months from Stockcharts.com):
S&P 500 or SPY
SDS (ProShares UltraShort S&P500)
U.S. Dollar Index (volatility index)
EEM (iShares MSCI Emerging Markets)
VIX (volatility index)
VXX (iPath S&P 500 VIX Short-Term Futures ETN)
EWG (iShares MSCI Germany Index Fund)
CAT (Caterpillar).
IBB (iShares Nasdaq Biotechnology).
Commentary
The market is doing its best to invalidate all the concerns I have raised about deteriorating technicals going into the last oversold period. In the wake of the Federal Reserve’s first rate hike in 9 years, and after 7 years of zero rates, the S&P 500 (SPY) made a power move with a 1.5% gain that closed the index nicely above converged resistance at the 50 and 200-day moving averages (DMAs).
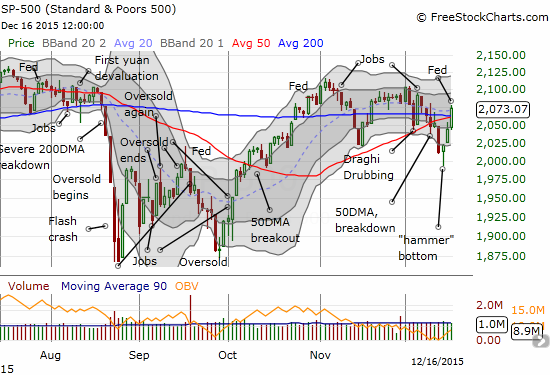
Even better, T2108, the percentage of stocks trading above their respective 40DMAs, soared from 21.5% to 30.0%. This move finally reverses all the losses from the last oversold period and then some. If (once?) T2108 closes above 30% alongside follow-through buying on the S&P 500, I may soon need to reconsider my assumption that the market printed a top going into the last oversold period.
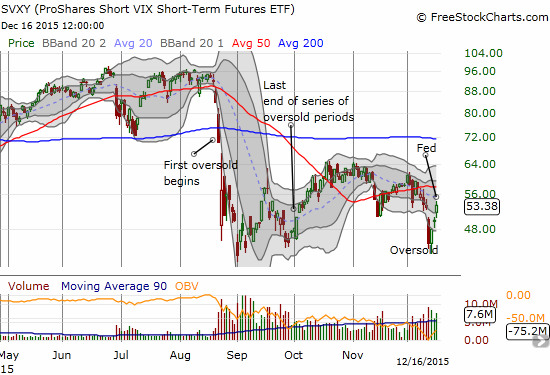
The best part of this big Fed day was that, once again, the post-Fed fade of volatility worked like a charm. I was quite surprised by the strength of the stock market, but not the strength of ProShares Short VIX Short-Term Futures (SVXY). I held my shares as long as I thought was prudent. Volatility eased throughout the press conference and pretty much stopped declining once the soothing words ended. I sold at that point.
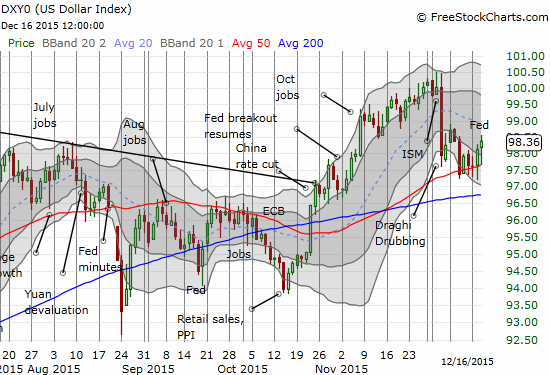
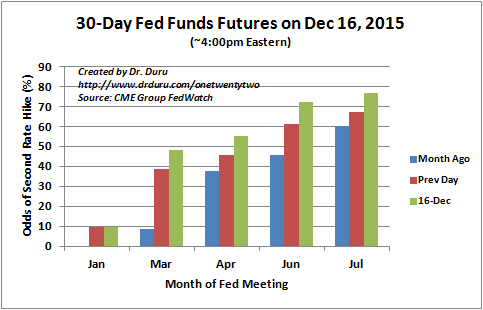
Interestingly, the U.S. dollar index (DXY0) held its 50DMA support through Fed day. I remain bullish on the U.S. dollar. Its ability to hang in there and confirm support underlines the bullish thesis of on-going policy divergence. I think there was a lot of guessing and second-guessing about whether a rate hike was already priced in. That point was moot as long as you believed, like me, that the Fed Funds futures told you all you needed to know about what the Fed would do. The better question now is what the market believes about subsequent rate hikes and how the Fed will dance around those expectations. April looks like the lucky winner for the next hike. That feels like an eternity away…
I am not going to over-predict or project what comes next for the stock market. I want to see how the market follows through. The short-term trading call stays at bullish. I will likely change that call to neutral if the market challenges the earlier highs as I will stay wary about the topping pattern.
In the meantime, I recommend interested readers review the data behind the “Santa Claus” rally. Around this time last year, I studied the data showing that the second half of December tends to perform strongly no matter what happens in the first half: see “The Numbers And Setup Behind This Year’s Potential Santa Claus Rally.” Back then, an imminent Fed meeting held out the potential for the start of rate normalization…
Daily T2108 vs the S&P 500
")
Black line: T2108 (measured on the right); Green line: S&P 500 (for comparative purposes)
Red line: T2108 Overbought (70%); Blue line: T2108 Oversold (20%)
Weekly T2108

*All charts created using freestockcharts.com unless otherwise stated
The charts above are the my LATEST updates independent of the date of this given T2108 post. For my latest T2108 post click here.
Related links:
The T2108 Resource Page
Expanded daily chart of T2108 versus the S&P 500
Expanded weekly chart of T2108
Be careful out there!
Full disclosure: long SVXY shares, long TLT call spread, long AAPL call options