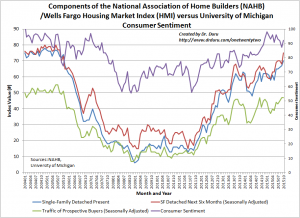
Exactly 10 years ago, the Housing Market Index (HMI) hit 68. The HMI fell relatively quickly from there as the bursting of the housing bubble began in earnest. This month, the HMI hit 64, essentially a fresh 10-year high. This indicator of homebuilder sentiment has marched steadily higher since the trough in the Spring of this year. A prime driver of this month’s gain from a revised 61 to 64 is the 6-month sales expectation for single-family detached homes. This component of the HMI surged from 68 to 75. This is an amazing 10% 1-month leap that matches a similar move from May to June of this year. It augurs very well for future earnings reports from homebuilders.
Click for larger image…

Source for data: National Association of Home Builders (NAHB)
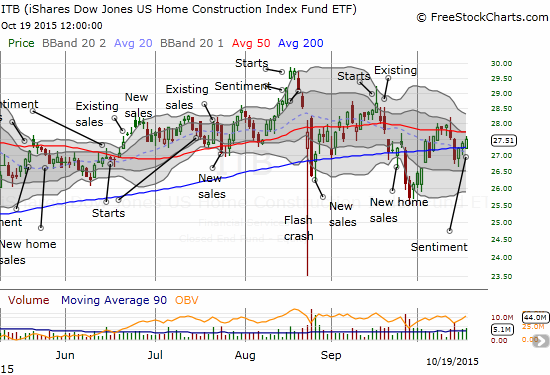
On a regional basis, the picture was very mixed. The Northeast surged from 46 to 52. This is the first time homebuilders in the region have been overall optimistic since November of 2014. The West surged from 65 to 76. The Midwest and the South both ticked down slightly. Both regions are still comfortably trending upwards in sentiment. As is often the case, homebuilder stocks did not enjoy much of a sympathetic uplift from the optimism. However, the iShares US Home Construction ETF (ITB) demonstrated relative strength once again versus the S&P 500 with respective gains of 0.5% versus 0.03%.

Source: FreeStockCharts.com
I remain bullish on the homebuilders. I consider the HMI as a confirming indicator of strong conditions for hoembuilders. I acknowledge the temptation to assume that a return to bubble highs suggests that the end may be near, but I consider such an analysis insufficient. Past history suggests that the TREND in sentiment is much more important that the specific level when it comes to anticipating prospecting for new home sales. So, as long as sentiment avoids a sudden or protracted downturn, I am comfortable with my bias to buy the dips in homebuilders.
Be careful out there!
Full disclosure: long ITB call options
