
The United States Oil ETF (USO) is down 1.0% in 2015. At its lowest point in 2015, USO was down 23.3%. At its highest point, USO was up 2.6%. This asymmetry alone seems to suggest that USO should tend higher in the short-term.
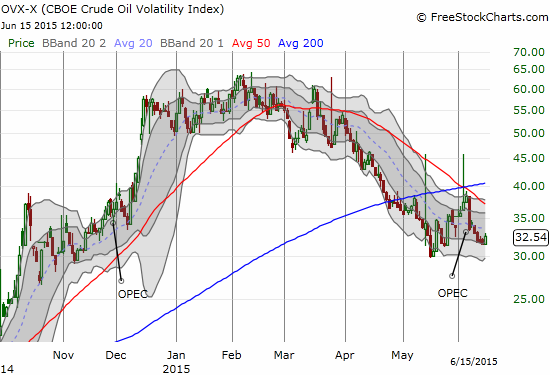
I make this assumption based on an on-going decline in volatility, measured by the CBOE Crude Oil ETF Volatility Index (OVX). The chart below shows how OPEC’s last two meetings have provided book-ends to volatility. In between, OVX has peaked and spent very little time, proportionally, actually trending higher. The choppy three-week run-up of volatility going into the last OPEC meeting was the longest uptrend since OVX ran into its March peak.
The decline in USO’s volatility has currently led into a very well-behaved trading range for USO. The chart below shows the dominance of the 50-day moving average (DMA) in 2015’s trading. In February and March, the 50DMA held firm as resistance. In several posts I have referenced the “bullish engulfing pattern” in March that looked like a bottom. This pattern features 1) a gap down with a low below the previous day’s low, 2) strong buying volume for the rest of the day that 3) closes the equity above the previous day’s high. When the low of the day coincides with a major low, like a 52-week low or the all-time low for USO, the odds favor a final washout of motivated sellers. True to form, this pattern has held as a firm bottom ever since.
When USO confirmed a breakout above its 50DMA with a second up day above this former line of resistance, the bottom for USO looked more solid than ever. The continued buying only slowed down when USO tested its intraday high for the year ($20.28). USO has pivoted around that line ever since and a rising 50DMA has provided picture-perfect support. Monday’s trading provided more confirmation of support as USO gapped down to the 50DMA and rallied from there.
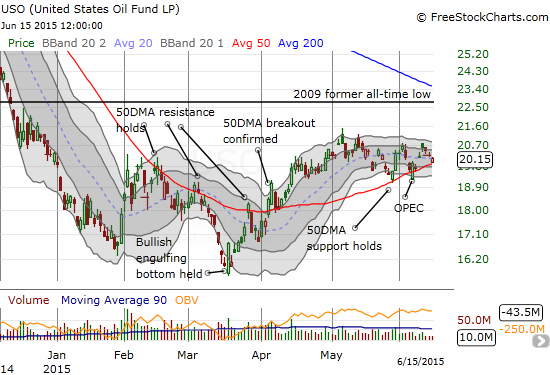
Source: FreeStockCharts.com
While the uptrend in the 50DMA could carry USO to a breakout above the current range, I am looking out for a few more tests of the tops and bottoms of the presumed range between $19 and $21. My latest trades have played USO off 50DMA support and off the top of the trading range. With the range tightening between the 50DMA and the upper-bound, I shortened the duration of my last trade and sold into the day’s rebound. From here, I will just wait to buy puts near the top of the range. On the bullish side, I prefer to buy call options on a multi-day descent into support. If/once the 50DMA finally gives way, I plan to reload one more time near the presumed bottom of the range.
I consider OVX to be a linchpin to this technical strategy. As long as OVX holds steady or declines, I expect USO to continue to behave more or less predictably around the 50DMA. If OVX breaks out, say above the pre-OPEC high, my trades will take on a much more bearish bias. I will assume that a breakout above or a breakdown below the presumed trading range will precede renewed directional momentum in favor of the break.
Be careful out there!
Full disclosure: no positions