
(T2108 measures the percentage of stocks trading above their respective 40-day moving averages [DMAs]. It helps to identify extremes in market sentiment that are likely to reverse. To learn more about it, see my T2108 Resource Page. You can follow real-time T2108 commentary on twitter using the #T2108 hashtag. T2108-related trades and other trades are occasionally posted on twitter using the #120trade hashtag. T2107 measures the percentage of stocks trading above their respective 200DMAs)
T2108 Status: 60.6%
T2107 Status: 54.2% (faded back from a breakout)
VIX Status: 12.6
General (Short-term) Trading Call: Neutral. Market still seems stuck in a chopfest. T2107 is still showing the potential for an important breakout.
Active T2108 periods: Day #119 over 20%, Day #78 above 30%, Day #22 above 40%, Day #6 over 50%, Day #1 over 60% (overperiod), Day #189 under 70%
Reference Charts (click for view of last 6 months from Stockcharts.com):
S&P 500 or SPY
SDS (ProShares UltraShort S&P500)
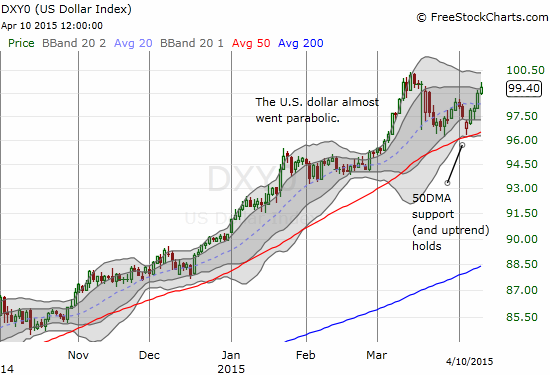
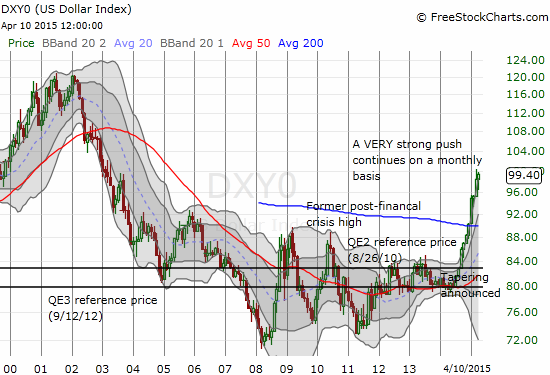
U.S. Dollar Index (volatility index)
EEM (iShares MSCI Emerging Markets)
VIX (volatility index)
VXX (iPath S&P 500 VIX Short-Term Futures ETN)
EWG (iShares MSCI Germany Index Fund)
CAT (Caterpillar).
Commentary
Earnings season is about to kick-off in earnest and all is as calm as can be. The volatility index, the VIX, closed at levels last seen in December.
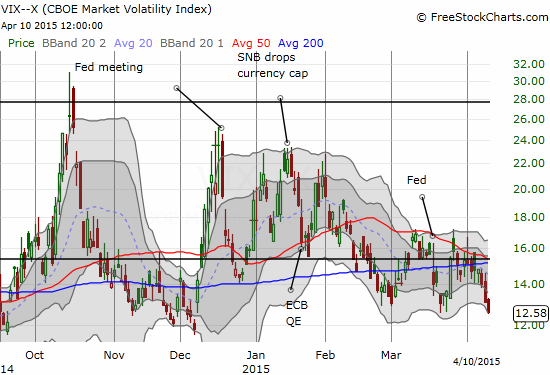
This lack of fear will make the market particularly vulnerable to negative surprises, but it is of course very possible Mr. Market will refuse to express surprise.
T2108 closed the week at 60.6% and made no progress from Monday’s close. The S&P 500 diverged a bit by managing to build on its gains from Monday’s rally to close over 2100 again.
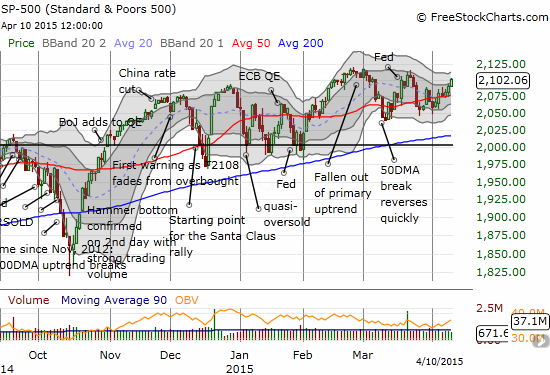
Now that the S&P 500 has returned to the top of its current chopping range, the risk of the low VIX is further amplified upon negative surprises.
Adding to the drama is the U.S. dollar index. Contrary to popular expectation, the re-strengthening of the dollar is NOT hurting the stock market. However, I suppose with the index re-establishng recent multi-year highs, we have yet one more element of tension as companies roll out earnings and repeat refrains from January to complain about the impact of dollar strength on financial performance.
Earnings usually trumps technicals, so I will be very cautious with the charts over the next two weeks or so. However, here are three of the top charts I am watching right now.
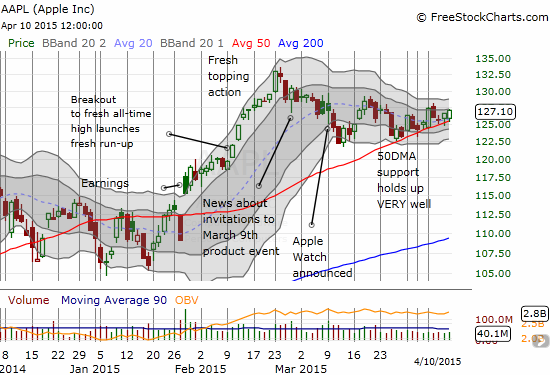
Apple (AAPL)
Last week was a rough week for the Apple Trading Model (ATM). My attempt to simplify the model happened to come during what should be an outlier week. An average week should feature ONE day where Apple (AAPL) does not follow through with its opening momentum. Last week, AAPL reversed course THREE times. On one of the two consistent days, the stock had to bounce back sharply to maintain the momentum from the open. Looking back, you can see that support at the 50-day moving average was the defining story. Lesson learned!
Note how AAPL has yet to close higher than it did the day before the announcement of the Apple Watch. In fact, it looks like a wedge is forming where a breakout, up or down, should lead to significant directional momentum.
iShares MSCI Emerging Markets (EEM)
China continues to rip higher as it drags EEM along with it. I established my hedged play just in time (described in the last T2108 Update). The huge burst above the 200DMA was just what the doctor ordered. It was so strong that, much to my pleasant surprise, it generated profits that more than covered the cost of my puts – by a large margin. I closed out the long side of the trade that day and can now just coast on the puts.
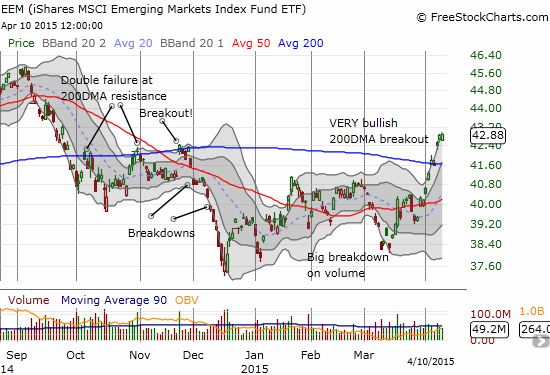
Breaking news: As I was putting the final touches on this piece, Chinese trade balance numbers came in VERY low – from FXStreet.com:
“…China Trade Balance (Mar), which came at CNY 18.8 bln vs exp CNY 250.0 bln, with exports -14.6% y/y (in yuan terms), while imports were -12.3% y/y (yuan terms), all components being a big miss…”
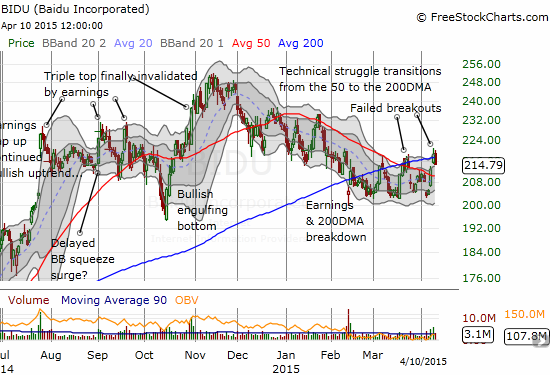
Baidu (BIDU)
BIDU is getting more and more interesting for swing trades. The downtrend channel I have been following seems now to be transitioning into more of a trading range. On Thursday, BIDU essentially broke free from the downtrend defined by its 50DMA only to run into stiff resistance at its 200DMA again. I traded call options into the top of what I thought would hold as the downtrend channel. It turned around on Thursday and faded the 200DMA breakout. I suspect the downside opportunity is limited to a test of the 50DMA as support as the stock tries to play catch-up to the strong rally in Chinese stocks (poor trade balance numbers notwithstanding).
Daily T2108 vs the S&P 500
")
Black line: T2108 (measured on the right); Green line: S&P 500 (for comparative purposes)
Red line: T2108 Overbought (70%); Blue line: T2108 Oversold (20%)
Weekly T2108

*All charts created using freestockcharts.com unless otherwise stated
The T2108 Resource Page
Expanded daily chart of T2108 versus the S&P 500
Expanded weekly chart of T2108
Be careful out there!
Full disclosure: net long the U.S. dollar, long put options on EEM and BIDU