
(T2108 measures the percentage of stocks trading above their respective 40-day moving averages [DMAs]. It helps to identify extremes in market sentiment that are likely to reverse. To learn more about it, see my T2108 Resource Page. You can follow real-time T2108 commentary on twitter using the #T2108 hashtag. T2108-related trades and other trades are occasionally posted on twitter using the #120trade hashtag. T2107 measures the percentage of stocks trading above their respective 200DMAs)
T2108 Status: 38.8%
T2107 Status: 45.2%
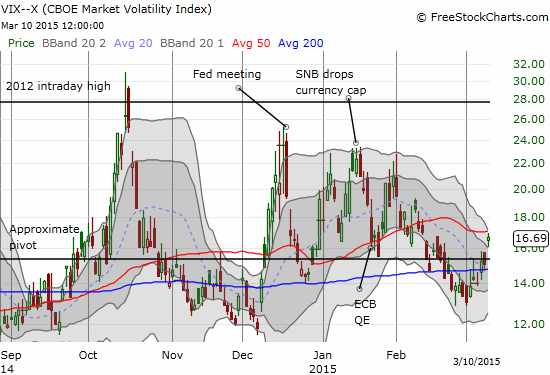
VIX Status: 16.7 (up 10.8%)
General (Short-term) Trading Call: Staying bearish until new all-time high or oversold. See caveat below. Looking for a bounce to fade.
Active T2108 periods: Day #97 over 20%, Day #56 above 30%, Day #1 under 40% (underperiod) (ending 35 days over 40%), Day #3 under 50%, Day #3 under 60%, Day #167 under 70%
Reference Charts (click for view of last 6 months from Stockcharts.com):
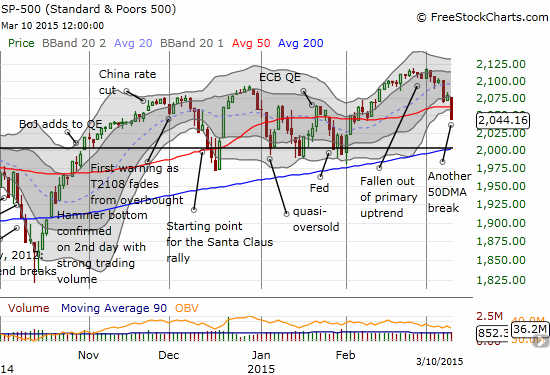
S&P 500 or SPY
SDS (ProShares UltraShort S&P500)
U.S. Dollar Index (volatility index)
EEM (iShares MSCI Emerging Markets)
VIX (volatility index)
VXX (iPath S&P 500 VIX Short-Term Futures ETN)
EWG (iShares MSCI Germany Index Fund)
CAT (Caterpillar).
Commentary
T2108 has proved its mettle once again. It is always more difficult to manage T2108’s overbought signals than its oversold signals, but with patience, the “close enough” rendezvous combined with strict technical levels on the S&P 500 (SPY) provided adequate warning of the current selling.
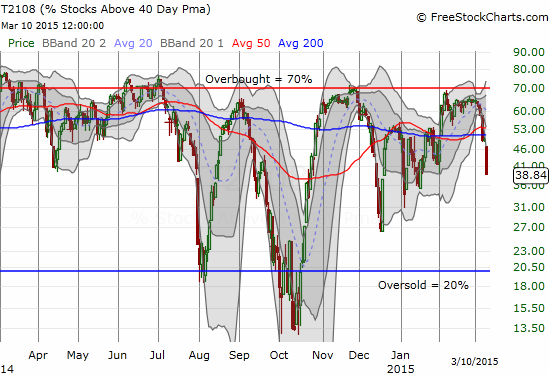
Now that the latest sell-off is underway, the general market is very aware of the risks. Managing short positions becomes a bit trickier. For example, T2108 has extended well below its lower-Bollinger Band (BB) and is subject to bounce sharply at any time. On Monday, the failure to mount a significant bounce from Friday’s selling demonstrated the new-found interest in selling. The chart of the S&P 500 is now well in-sync with T2108. On Tuesday, the index broke right through 50DMA support and extended below its lower-BB again.
I reacted to the selling by closing out my call options on ProShares Ultra VIX Short-Term Futures (UVXY). I think this could be timely given the volatility index has popped right into its 50DMA.
On Monday, I used the small rise in the S&P 500 to nibble on ProShares Ultra S&P500 (SSO) put options. Even with the 70% gain in one day’s work, I decided to hold onto this side of my T2108 bearish bet (and of course I wish I had been MUCH more aggressive!). If the index gaps down Wednesday morning (seems to never happen anymore as follow-through), I will close this position out. If the index bounces, I will start buying a fresh position of call options on UVXY.
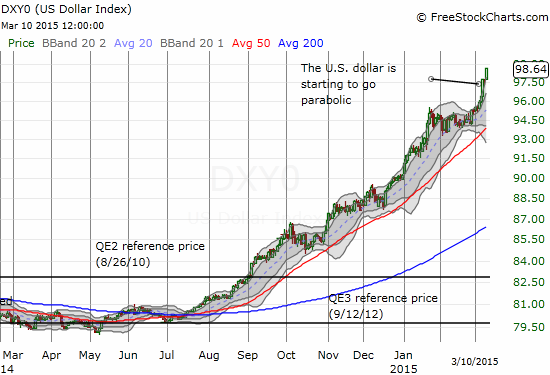
After a twitter chat, I realized that the current short-term trading pivots around next week’s Fed meeting (March 16th and 17th). I expect volatility to trend upward into the Fed’s meeting and perhaps into the subsequent press conference. I then expect volatility to collapse, or at least the premium built into volatility between now and then should reverse. Regular readers likely recall that my favorite post-Fed trade is to fade volatility as the Fed typically does what it can to calm markets down. The Fed may feel particularly compelled to sooth fears given the strong run-up in the U.S. dollar and growing “fears” about rate hikes. (Nevermind, the Fed is unlikely to raise rates much even after it begins the tightening cycle). My SSO puts are targeting the Friday, March 27th expiration, the week following the Fed, so I am staying patient. Only a break through 2100 and definitely a new all-time high will end my bearish trading call before oversold conditions (or “close enough”).
On the forex side of things, the Australian dollar versus the Japanese yen (AUD/JPY) is confirming trouble ahead as it is falling from 50DMA resistance.

With the NASDAQ (QQQ) getting stopped cold at 5000 and just short of its all-time high, you can bet that investors and traders are looking at tech holdings a little more anxiously. No one of course wants to get caught holding the bag…especially again 15 years later!

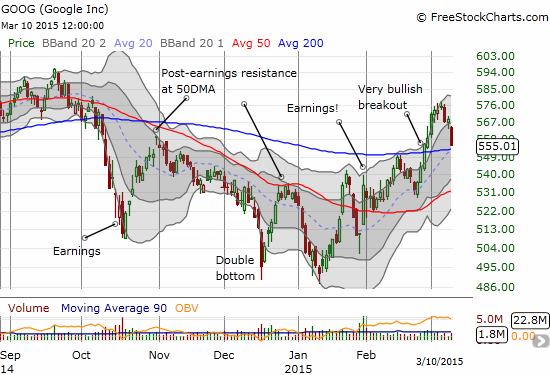
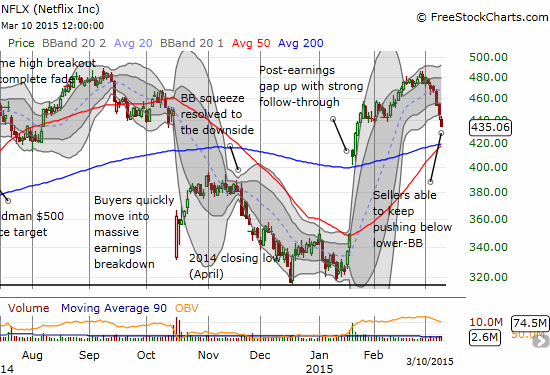
You can see the rapid exit in tech stocks like Netflix (NFLX) and Google (GOOG)…
Oil-related stocks are facing renewed heat as well.
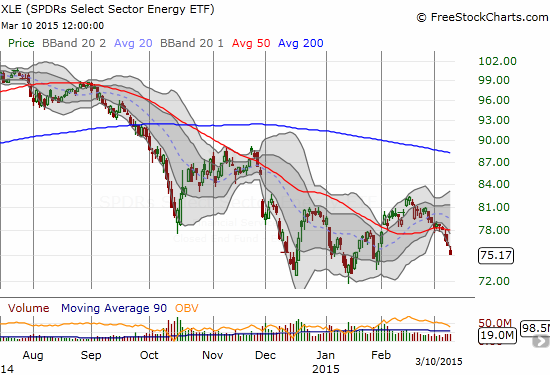
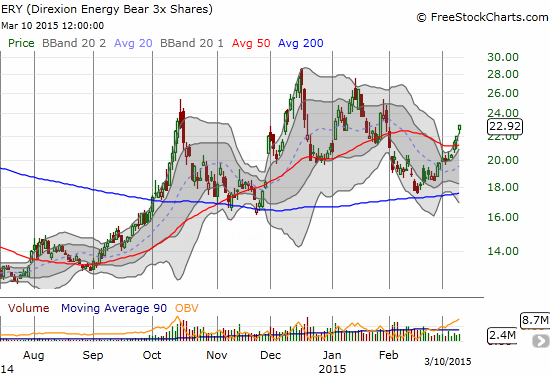
Bearish bets on XLE provide a nice double-whammy because it can drop on either lower oil and/or a weaker stock market. However, I sold my latest accumulated position in Direxion Daily Energy Bear 3X ETF (ERY) as it stretched above the upper-BB for a third straight day. Not only does the low selling volume on XLE have me wary, but it also looks like ERY is making a series of lower highs.
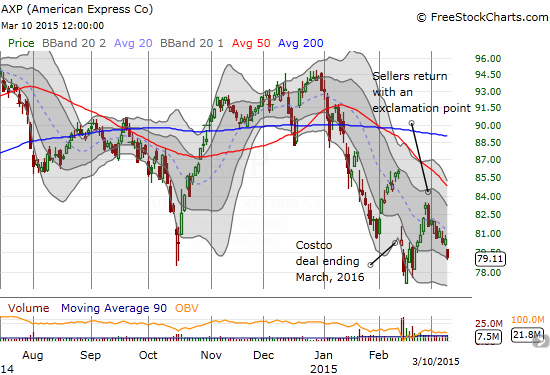
I also closed out my put options on American Express (AXP). I was probably a bit early as a retest of recent lows is definitely in play here.
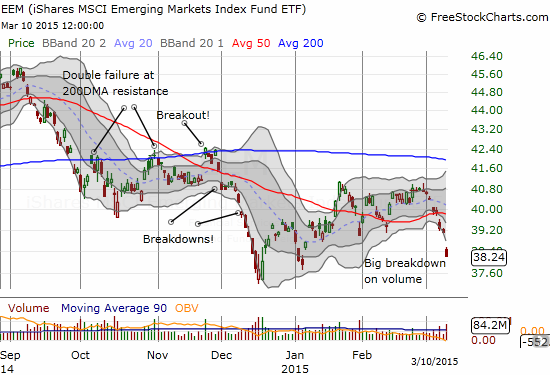
Somehow, I completely forgot to restart my hedged trading strategy on iShares MSCI Emerging Markets (EEM) before the sell-off. Options on EEM were again extremely cheap considering the potential for sharp and quick moves. I somewhat corrected my mistake by grabbing a large position today. I got put options expiring in April to give me sufficient runway to take advantage of what could eventually be a nasty tumble to or below 2014 lows almost no matter what the Fed does next week. I got call options expiring next week in case EEM rallies in spite of itself. Right now, EEM is WELL below the lower-BB and subject to a sharp reversal. I will sell the call options into such a reversal and hopefully those profits will pay for at least half of the put options.
And in case you are somehow not following the currency markets closely (shame on you if you are a trader!), I have to remind you that the dollar is soaring and the move is getting parabolic. Whatever fears are baked into the implications of a rising dollar could be reaching a crescendo right along with the Fed meeting.
Needless to say, March is shaping up to be a pivotal month for financial markets!
Daily T2108 vs the S&P 500
")
Black line: T2108 (measured on the right); Green line: S&P 500 (for comparative purposes)
Red line: T2108 Overbought (70%); Blue line: T2108 Oversold (20%)
Weekly T2108

*All charts created using freestockcharts.com unless otherwise stated
The T2108 Resource Page
Expanded daily chart of T2108 versus the S&P 500
Expanded weekly chart of T2108
Be careful out there!
Full disclosure: long SSO put options, net long the U.S. dollar, net short the Australian dollar, long EEM calls and options, short NFLX and long call options