
(T2108 measures the percentage of stocks trading above their respective 40-day moving averages [DMAs]. It helps to identify extremes in market sentiment that are likely to reverse. To learn more about it, see my T2108 Resource Page. You can follow real-time T2108 commentary on twitter using the #T2108 hashtag. T2108-related trades and other trades are posted on twitter using the #120trade hashtag)
T2108 Status: 65.2% (ends last overbought period at 5 days)
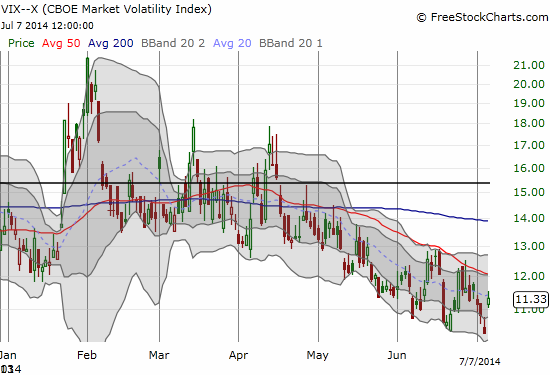
VIX Status: 11.3 (up about 10%)
General (Short-term) Trading Call: Hold. Stop for longs on the S&P 500 remains at 1962
Active T2108 periods: Day #251 over 20%, Day #103 over 40%, Day #30 over 60% (overperiod), Day #1 under 70% (underperiod)
Reference Charts (click for view of last 6 months from Stockcharts.com):
S&P 500 or SPY
SDS (ProShares UltraShort S&P500)
U.S. Dollar Index (volatility index)
EEM (iShares MSCI Emerging Markets)
VIX (volatility index)
VXX (iPath S&P 500 VIX Short-Term Futures ETN)
EWG (iShares MSCI Germany Index Fund)
CAT (Caterpillar).
Commentary
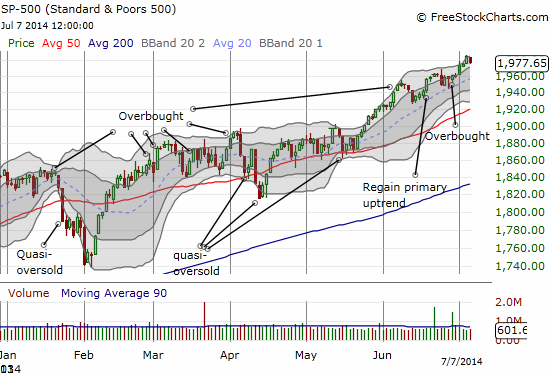
Today (July 7, 2014), T2108 officially fell out of overbought conditions and closed at 65.2%. It was a healthy plunge that I would typically interpret as being a major sell signal. However, the S&P 500 (SPY) did not even break a sweat: it did not even close below the low from Thursday’s holiday shortened trading.
The volatility index, the VIX, responded to the selling by leaping about 10%, but it is still in a steep downtrend.
Underlining my hesitancy to change the trading call to a sell is that my study of July trading suggests that “buy in July” is an operative adage – looking for dip-buying opportunities is likely to pay off better than shorting and buying puts for hyper-quick trades.
Momentum stocks may present the BIG exception to this sanguine, even bullish, assessment. I do not have the time or opportunity to post a bunch of representative charts, but I do want to point to at least a few examples.
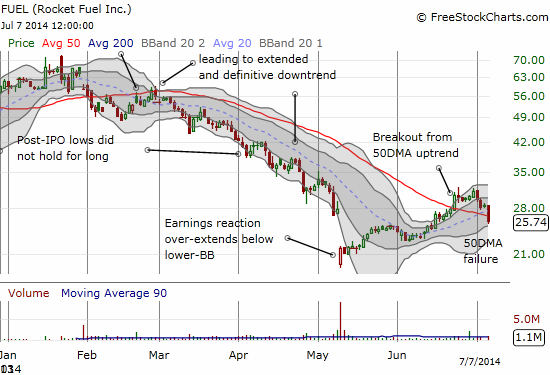
First, Rocket Fuel (FUEL) was the stock that suggested to me that this year’s great sell-off in momentum stocks could be coming to an end. Now it is suggesting that the bounce/relief rally/recovery is finally running out of gas.
Here is one way to think of what COULD be happening…
When investors and traders woke up one morning and suddenly decided that a bunch of stocks were not worth their high multiples, the earnings reports in April seemed to validate the epiphanies. These most eager sellers exited fast and furiously – so much so, that they exhausted selling interest in short order, often times in big, climactic surges of trading volume…like FUEL. The cessation of selling invited buying into the vacuum. Now, these buyers are trying to decide whether they dare hold these stocks through the upcoming earnings season, knowing what devastation happened three months ago or so. Profits in hand, for many traders, it makes little sense to take the risk. Thus, the rally loses its gas, loses its momentum. Hard to say whether the exit will turn into another avalanche. Only time will tell. Either way, watch for some explosive post-earnings moves over the next month, up or down.
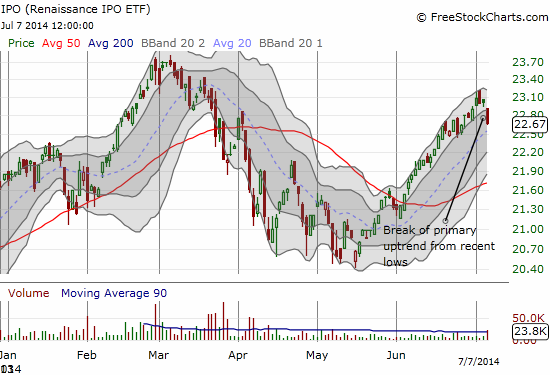
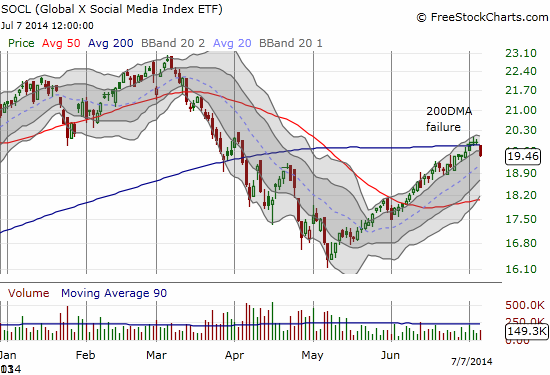
Other indicators of the slowing momentum in high-multiple stocks are indices full of them like Global X Social Media Index ETF (SOCL) and Renaissance IPO ETF (IPO).
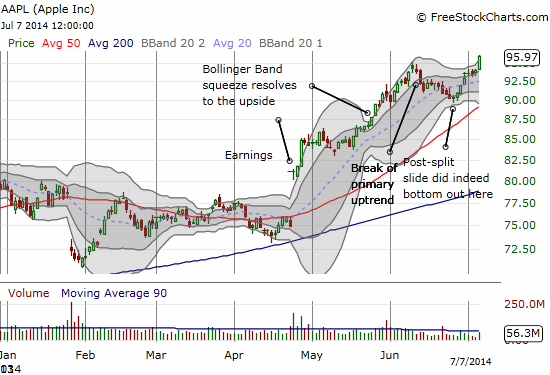
Apple (AAPL) is the “counter-exception.” Its stock broke out today on a 2% gain to new 52-week highs. Perhaps it will regain its title as a momentum stock of choice. It certainly looks on course to get to new all-time highs as I laid out in early May and reinforced in later pieces. I am also gratified to see that my call for an end to the post-split slip proved itself out. Moreover, the Apple Trading Model (ATM) had another huge day today.
Overall, stay cautious and watch 1962 on the S&P 500 (SPY).
Daily T2108 vs the S&P 500
")
Black line: T2108 (measured on the right); Green line: S&P 500 (for comparative purposes)
Red line: T2108 Overbought (70%); Blue line: T2108 Oversold (20%)
Weekly T2108

*All charts created using freestockcharts.com unless otherwise stated
Related links:
The T2108 Resource Page
Expanded daily chart of T2108 versus the S&P 500
Expanded weekly chart of T2108
Be careful out there!
Full disclosure: long FUEL