(T2108 measures the percentage of stocks trading above their respective 40-day moving averages [DMAs]. It helps to identify extremes in market sentiment that are likely to reverse. To learn more about it, see my T2108 Resource Page. You can follow real-time T2108 commentary on twitter using the #T2108 hashtag. T2108-related trades and other trades are posted on twitter using the #120trade hashtag)
T2108 Status: 65.1%
VIX Status: 12.6 (8.3% increase)
General (Short-term) Trading Call: Aggressive bears short with a tight stop. Trend-followers should be stopped out or at least consider bailing. For more see below.
Active T2108 periods: Day #235 over 20%, Day #87 over 40%, Day #14 over 60% (overperiod), Day #2 under 70% (underperiod)
Reference Charts (click for view of last 6 months from Stockcharts.com):
S&P 500 or SPY
SDS (ProShares UltraShort S&P500)
U.S. Dollar Index (volatility index)
EEM (iShares MSCI Emerging Markets)
VIX (volatility index)
VXX (iPath S&P 500 VIX Short-Term Futures ETN)
EWG (iShares MSCI Germany Index Fund)
CAT (Caterpillar).
Commentary
The bearish rumblings are getting louder as T2108 dropped further away from overbought territory. Today, it fell to 65.1% confirming the unlikely return to overbought status anytime soon. I did not want to issue the bear call in the last T2108 Update because I did not see enough confirmation of a sell signal. Now I do. Yet, I am also compelled to tread carefully…
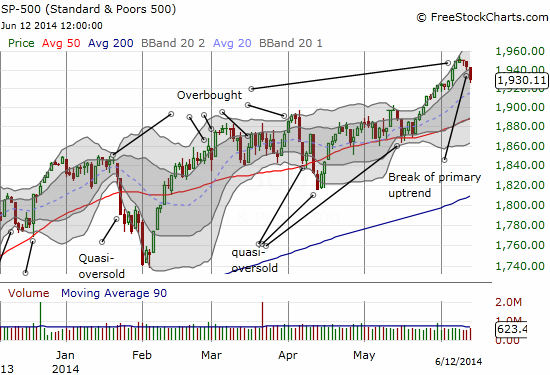
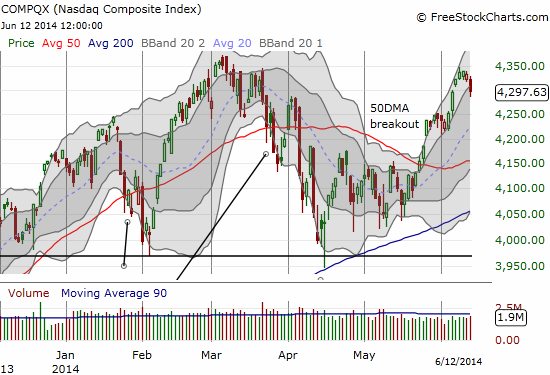
The S&P 500 (SPY) only fell 0.7%, but it was enough to end the primary uptrend defined by the two upper-Bollinger Bands. This pullback is now likely to extend at least to yet another 50DMA retest before it ends. The NASDAQ (QQQ) fell a similar percentage (0.8%). The end of its uptrend looks more ominous because it looks like a failed retest of the 2014 (and multi-year high).
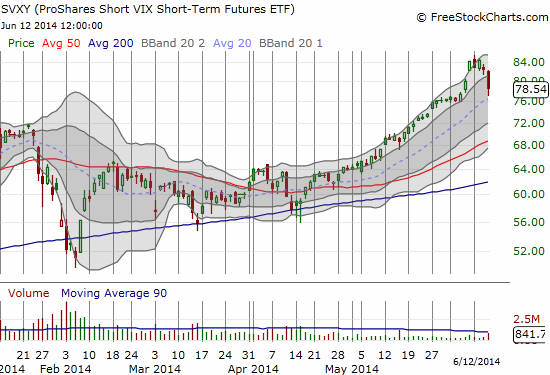
The volatility index, the VIX, perked up today to the tune of 8.3%. It was enough to give ProShares Ultra VIX Short-Term Fut ETF (UVXY) a VERY rare day to celebrate. The move was also enough to give ProShares Short VIX Short-Term Fut ETF (SVXY) the look of a top – perhaps just in time for me to make money on puts I purchased ahead of the overbought period. (With a $73 strike and June 21 expiration, I need SVXY to have at least one more day like today…very soon). As usual, I will soon be scoping for opportunities to go short UVXY. I will likely wait until I have expanded my bearish positions – turning UVXY puts into a hedge. However, it is sure tempting to start here given the definitive downtrend on UVXY and the lingering downtrend on the VIX still defined by the falling 50DMA.
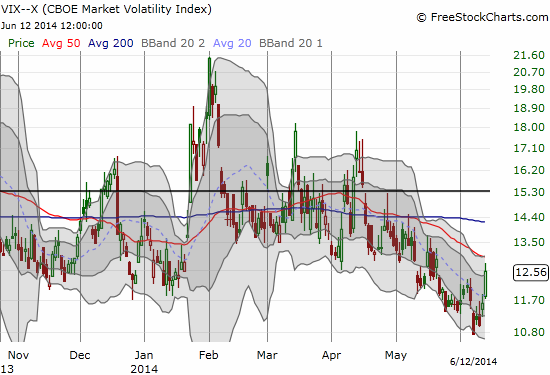
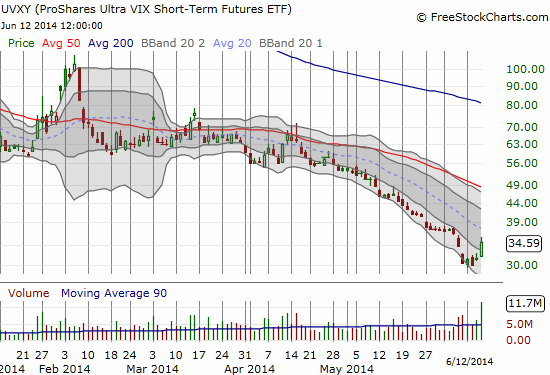
A reaction in volatility is a key ingredient in my assessment that the bearish rumblings are getting louder. Alert traders are getting in on cheap protection here with put options.
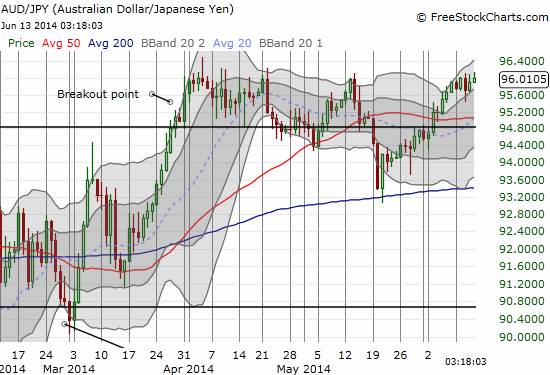
However, the Australian dollar (FXA) is not showing any signs of cooperating with bearish sentiment. Even as iron ore tumbled to fresh 21-month lows, the Australian dollar is bravely inching higher anyway. The Australian dollar versus the Japanese yen (AUD/JPY) is still hanging out near a fresh breakout. The disconnect between the Australian dollar and collapsing iron ore prices is for me one of the more bewildering dynamics of this period of extremely low implied volatilities (and presumably high complacency).
The trading strategy at this point assumes that T2108 is not returning to overbought territory anytime soon.
- If you went long primarily to follow the S&P 500 uptrend, seriously consider exiting that position if you have not already been stopped out. Return to the position on a close above today’s high. The trend will likely re-establish itself at that point.
- If you are aggressively bearish, you should get short (like long SSO pts or QID calls) with a tight stop at fresh all-time highs on the S&P 500. A stop on the NASDAQ can be placed above the 2014 high.
- If this quick drop from overbought conditions is like earlier patterns, traders should prepare for a lot of churn.
- Size positions appropriately and accordingly!
Finally, note that I am staying on the lookout for quick, VERY select, bullish trades (on dips) in individual stocks, and I will execute as the situation seems fit. I am not (yet) convinced the market is on the edge of one of those swift summer swoons. For example, I need that Australian dollar to at least get some nervous legs (without the Reserve Bank of Australia doing the spooking that is). A break of support at the S&P 500’s 50DMA will also get me reconsidering.
Daily T2108 vs the S&P 500

Black line: T2108 (measured on the right); Green line: S&P 500 (for comparative purposes)
Red line: T2108 Overbought (70%); Blue line: T2108 Oversold (20%)
Weekly T2108

*All charts created using freestockcharts.com unless otherwise stated
Related links:
The T2108 Resource Page
Expanded daily chart of T2108 versus the S&P 500
Expanded weekly chart of T2108
Be careful out there!
Full disclosure: long SVXY puts

Late correction – note that while the NASDAQ stopped short of a new high, QQQ is still ABOVE the previous high. So, there is a very mixed signal for going short tech in this case.
I was VERY tentative in opening up new bearish positions Just a single SSO put and a single QID call. If the issue is the unfortunate news coming from Iraq, we already know from recent experience that the market will forget about these troubles very quickly. Iraq is not (yet?) a reason to sell anything.