
(T2108 measures the percentage of stocks trading above their respective 40-day moving averages [DMAs]. It helps to identify extremes in market sentiment that are likely to reverse. To learn more about it, see my T2108 Resource Page. You can follow real-time T2108 commentary on twitter using the #T2108 hashtag. T2108-related trades and other trades are posted on twitter using the #120trade hashtag)
T2108 Status: 63.3% (ends a 10-day overbought period)
VIX Status: 12.7 (surprisingly flat)
General (Short-term) Trading Call: Stay short.
Active T2108 periods: Day #92 over 20% (overperiod), Day #5 under 70%
Reference Charts (click for view of last 6 months from Stockcharts.com):
S&P 500 or SPY
SDS (ProShares UltraShort S&P500)
U.S. Dollar Index (volatility index)
EEM (iShares MSCI Emerging Markets)
VIX (volatility index)
VXX (iPath S&P 500 VIX Short-Term Futures ETN)
EWG (iShares MSCI Germany Index Fund)
CAT (Caterpillar)
Commentary
A strange divergence has unfolded between T2108 and the S&P 500 (SPY). Ever since the last overbought period ended, T2108 has steadily moved lower…as expected. However, the S&P 500 has not followed as expected. At the end of today’s trading the S&P 500 traded within a hair of its all-time high, and it is a hair higher than its value at the end of the last overbought period.
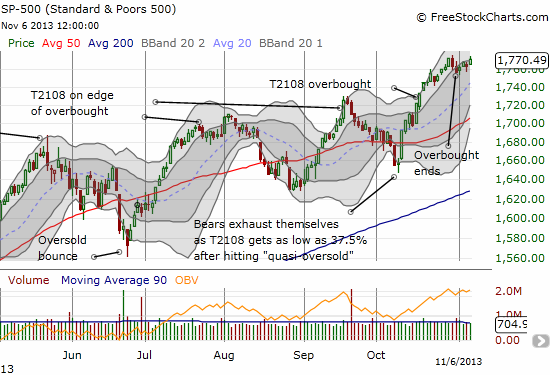
Normally, I would call this a bearish divergence, but I have learned my lesson from previous episodes of divergence. What makes this one so strange is that recent history shows that the end of the overbought period tends to generate a sell-off, sometimes substantial. If you had asked me last week, I would have told you that the S&P 500 would only go higher if T2108 quickly returned to overbought levels. With T2108 drifting away from overbought levels, I am on the edge of my seat waiting for a resolution. I am still betting on follow-through selling.
As my puts on S&P 500 Ultra Shares (SSO) slowly shrivel away, I find the T2108 trade completing an incredible run this year. It is more reminiscent of the amazing success T2108 had in 2011 when the market was kind enough to deliver multiple oversold episodes that proved to be very buyable. This was also the year that I removed the automatic bearish signal from overbought conditions. For example, if T2108 manages to flip overbought again in the next week or so, I will likely try chasing SSO higher for a brief spell.
There is only one main negative that I see on the horizon at this point. Surprisingly, interest rates are creeping higher again. This increase looks like noise so far until rates make a new high (also note below that mortgage rates have not joined bond rates higher). Since emerging market stocks have come in recent days, I am once again watching rates closely.
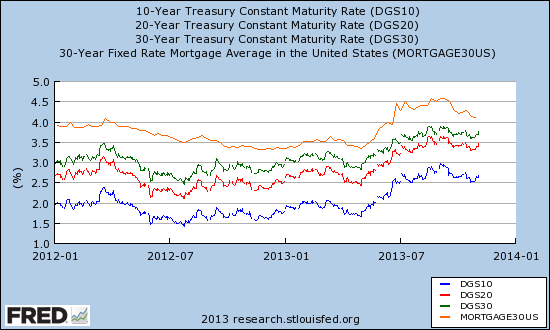
Source: The St. Louis Federal Reserve
Daily T2108 vs the S&P 500
")
Black line: T2108 (measured on the right); Green line: S&P 500 (for comparative purposes)
Red line: T2108 Overbought (70%); Blue line: T2108 Oversold (20%)
Weekly T2108

*All charts created using freestockcharts.com unless otherwise stated
Related links:
The T2108 Resource Page
Expanded daily chart of T2108 versus the S&P 500
Expanded weekly chart of T2108
Be careful out there!
Full disclosure: long SSO puts, long calls and puts on EEM and TLT