(T2108 measures the percentage of stocks trading above their respective 40-day moving averages [DMAs]. It helps to identify extremes in market sentiment that are highly likely to reverse. To learn more about it, see my T2108 Resource Page. You can follow real-time T2108 commentary on twitter using the #T2108 hashtag. T2108-related trades and other trades are posted on twitter using the #120trade hashtag)
T2108 Status: 64.7%
VIX Status: 12.7
General (Short-term) Trading Call: Aggressive traders who got long the breakout should continue locking in profits
Active T2108 periods: Day #22 over 20% (overperiod), Day #8 over 60%, Day #49 under 70%
Reference Charts (click for view of last 6 months from Stockcharts.com):
S&P 500 or SPY
SDS (ProShares UltraShort S&P500)
U.S. Dollar Index (volatility index)
VIX (volatility index)
VXX (iPath S&P 500 VIX Short-Term Futures ETN)
EWG (iShares MSCI Germany Index Fund)
CAT (Caterpillar)
Commentary
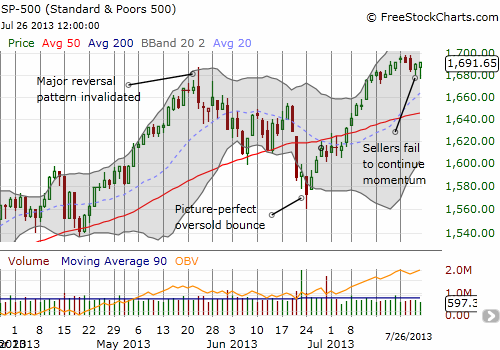
On July 24th, T2108 fell back from the brink of overbought territory as the S&P 500 (SPY) experienced its biggest percentage loss since bouncing from oversold conditions exactly a month ago. The index only fell 0.4%, but the rare loss was enough to generate the first potentially bearish sign I have seen since late June. The “scare” was brief. During each of the next two days, sellers managed to drive the S&P 500 to new intraday lows for the week, only to get steamrolled by buyers who closed out the day strong. This stubborn action is likely setting things up for an overbought breakthrough this week.

If a breakout occurs, I will NOT become bearish right away. For any hedge fund or institutional investor who is caught under-invested in such a move, the pressure will increase exponentially to play catch-up. Under such a scenario, I prefer to continue to look for beaten up stocks with low expectations. They will look “cheap” to anyone who wants to participate in a market breakout without buying directly at all-time highs.
The biggest upcoming caveats are the number of macro-economic events layered onto the end of July’s earnings season. Most importantly, we have a Federal Reserve decision on Wednesday, July 31st and another jobs report on Friday, August 2nd. In between there, we also have our typical first of the month rally. I am looking for the Fed to provide additional reassurance to the market about its bias for easing. I also suspect the market will rally almost no matter what the jobs report says: a bad report means more easing, a good report means a good economy. Regardless, it will be important not to over-interpret any move this week and instead wait for the dust to settle with the closing bell on Friday.
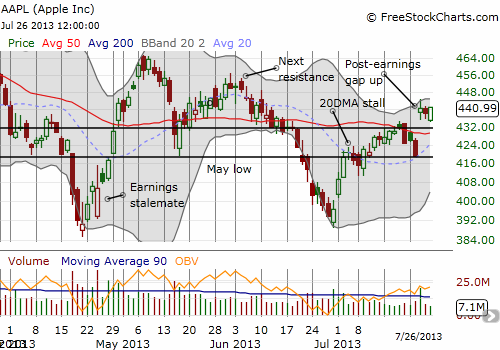
In other news, the Apple (AAPL) earnings play went well although the execution could have been much improved. The stock executed a complete turnaround on the post-earnings day with a 5.1% gain that aligned well with the historical patterns I have pointed out. I was poorly positioned with the weekly $450 calls that expired on Friday, so near the pre-earnings close I bought a (monthly) August $440/450 call spread (tweeted with the #120trade hashtag). I sold that spread when it seemed AAPL’s momentum was already waning. It turned out to be a bit premature. I remain biased bullish on AAPL’s stock. It could be a key target for hedgies looking to catch-up to the S&P 500’s strong year-to-date performance (18.6%!).

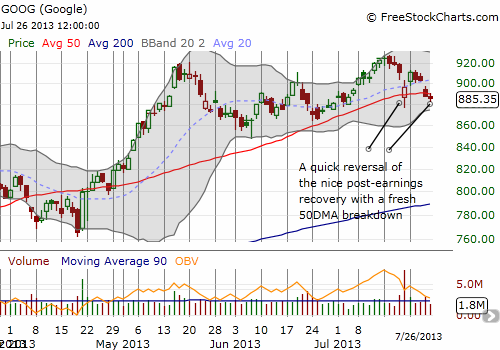
Google (GOOG) surprised me by closing below its 50DMA on Thursday and following through on Friday. It is now already back where it opened the day after earnings the previous week. Such a quick reversal of a reversal is usually a bad sign, but I pressed on anyway with a (monthly) August 915/925 call spread AND weekly Aug 915 calls expiring this Friday. I tweeted the first trade. The second trade executed later in the day after I indicated I had placed a low ball order. I am much more optimistic about the call spread, and I will likely sell the weekly call early into any rally this week.

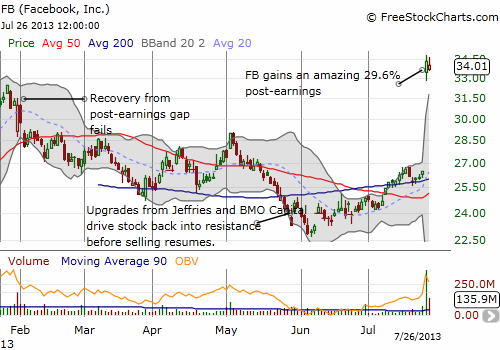
I suspect renewed excitement over Facebook is drawing attention and money away from Google (GOOG). All I can say is thank goodness I covered my FB short near the June lows (also posted on twitter). I still had some leftover put options that are of course now worthless. I will have to dedicate an entire post to Facebook in the coming future. I remain bearish and see this current surge as an unexpected opportunity to rebuild a position at much better prices. I will of course be VERY patient in initiating it. I started with some speculative monthly August puts just in case the stock swoons ahead of the time I am ready to sit on some shorted shares.

Finally, see “Amazon.com Returns To Typical Post-Earnings Behavior” for a description of the success I had playing Amazon.com (AMZN) post-earnings.
Daily T2108 vs the S&P 500

Black line: T2108 (measured on the right); Green line: S&P 500 (for comparative purposes)
Red line: T2108 Overbought (70%); Blue line: T2108 Oversold (20%)
Weekly T2108

*All charts created using freestockcharts.com unless otherwise stated
Related links:
The T2108 Resource Page
Expanded daily chart of T2108 versus the S&P 500
Expanded weekly chart of T2108
Be careful out there!
Full disclosure: long AAPL shares; long GOOG call spread and calls; long FB puts
