
(T2108 measures the percentage of stocks trading above their respective 40-day moving averages [DMAs]. It helps to identify extremes in market sentiment that are highly likely to reverse. To learn more about it, see my T2108 Resource Page. You can follow real-time T2108 commentary on twitter using the #T2108 hashtag. T2108-related trades and other trades are posted on twitter using the #120trade hashtag)
T2108 Status: 37.9% (plunge from 45.4%)
VIX Status: 17.1 (surprise, surprise, below support again!)
General (Short-term) Trading Call: Hold
Active T2108 periods: Day #1 under 40% (underperiod), Day #14 under 70% (underperiod)
Reference Charts (click for view of last 6 months from Stockcharts.com):
S&P 500 or SPY
SDS (ProShares UltraShort S&P500)
U.S. Dollar Index (volatility index)
VIX (volatility index)
VXX (iPath S&P 500 VIX Short-Term Futures ETN)
EWG (iShares MSCI Germany Index Fund)
CAT (Caterpillar)
Commentary
The S&P 500 (SPY) did not quite gap up on Monday as I was (eagerly) anticipating, but it did give bears a decent scare. For a brief moment the index cracked its 20DMA resistance and looked ready to print strong follow-through to a two-day rally. Instead, the index pulled back and closed flat. However today (Tuesday, June 11th), the S&P 500 followed through with a technical failure at the resistance from the downtrend line drawn from all-time highs. The S&P 500 finds itself neatly wedged between that resistance and support from the bear/bull dividing line. The 50DMA is rapidly rising to join this wedge.
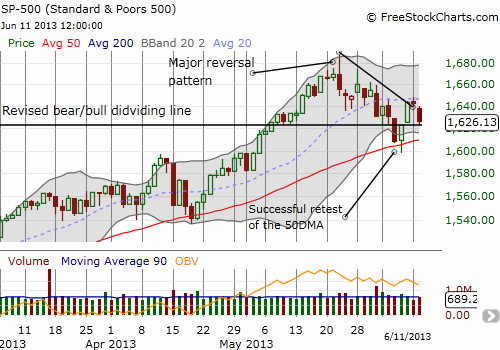
While I missed an opportunity to play SSO puts against resistance as was my original plan, I think a much bigger play awaits on following the breakout from this wedge pattern, up or down. I highly doubt the S&P 500 will “survive” another test of its 50DMA so quickly after last week’s. The last three tests of this rising uptrend line have been “easy” plays to buy into the uptrend for a small discount. The many weeks in between provided enough confidence that the next test will also succeed. Another visit so soon can erode confidence, motivate sellers, and encourage the bears.
A big complication comes in the form of T2108. It plunged today by 16.3%, setting up a potential quasi-oversold condition by Wednesday’s close. Another plunge on Wednesday will almost surely generate a high probability for a bounce the following day. I will do my best to run the model, if applicable, near the close and make the trading call then (follow my twitter feed and/or monitor the hashtag #120trade). Although the T2108 Trading Model (TTM) is more reliable for predictions of an up day, I will treat a prediction for a down day as one more piece of evidence that a decisive break of 50DMA support is on its way.
A final red flag is the VIX. It has now managed to stay aloft above the critical 15.2 support/resistance line for 7 of the last 8 days. This is the VIX’s most resilient performance for the year. This behavior suggests that “this time may be different” and higher volatility may stick around a while longer (see my piece making the case for a summer full of volatility in “May 2013 Was Fine As Expected; Now Brace For Summer Volatility“). Toss in the sharply increased volatility coming from Japanese financial markets, and we have a bubbly cauldron waiting to spill over.
(In case you are not following trades on twitter, note that on Monday I was stopped out of my Google (GOOG) call relatively quickly. It caused me to miss out on a decent amount of extra profit, but it prevented me from giving back almost all my profit on GOOG’s small pullback on Tuesday).
Daily T2108 vs the S&P 500
")
Black line: T2108 (measured on the right); Green line: S&P 500 (for comparative purposes)
Red line: T2108 Overbought (70%); Blue line: T2108 Oversold (20%)
Weekly T2108

*All charts created using freestockcharts.com unless otherwise stated
Related links:
The T2108 Resource Page
Expanded daily chart of T2108 versus the S&P 500
Expanded weekly chart of T2108
Be careful out there!
Full disclosure: no positions