(T2108 measures the percentage of stocks trading above their respective 40-day moving averages [DMAs]. It helps to identify extremes in market sentiment that are highly likely to reverse. To learn more about it, see my T2108 Resource Page. You can follow real-time T2108 commentary on twitter using the #T2108 hashtag. T2108-related trades and other trades are posted on twitter using the #120trade hashtag)
T2108 Status: 59.2%
VIX Status: 13.6
General (Short-term) Trading Call: Hold with caution and take some profits
Reference Charts (click for view of last 6 months from Stockcharts.com):
S&P 500 or SPY
SDS (ProShares UltraShort S&P500)
U.S. Dollar Index (volatility index)
VIX (volatility index)
VXX (iPath S&P 500 VIX Short-Term Futures ETN)
EWG (iShares MSCI Germany Index Fund)
CAT (Caterpillar)
Commentary
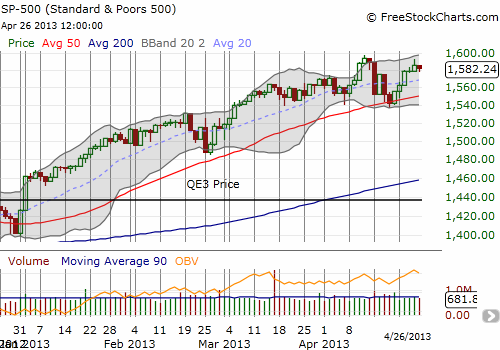
A LOT has happened in the week since I last wrote a T2108 Update. Through it all, the S&P 500 (SPY) has steadily marched higher with a near picture-perfect bounce off its 50DMA.

This bounce turned the trade on quasi-oversold conditions into a very profitable one. I sold 70% of my SSO calls on Thursday as the S&P 500 stretched for its upper-Bollinger Band (I erroneously reported on twitter that I only sold 50% of them). I had been very patient up until then waiting for the S&P 500 to deliver and figured it was time to lock in some profits with the index at such a critical test. The S&P 500 just barely avoided a red flag warning of a potential double top the next day (Friday, April 26th). The lows stopped right at the previous day’s low, thus preserving the upward momentum. A lower close would have signified a follow-through fade from Thursday’s failure at resistance at the all-time highs.
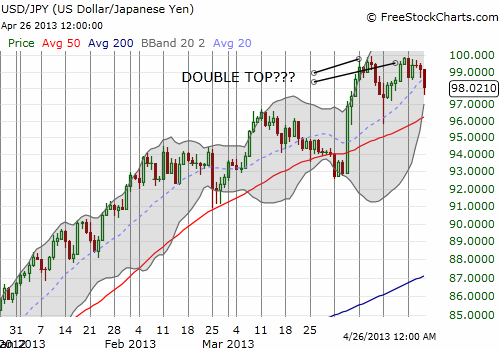
This is important because the Japanese yen (FXY) seems to have made a potential double-top against the U.S. dollar (USD/JPY).

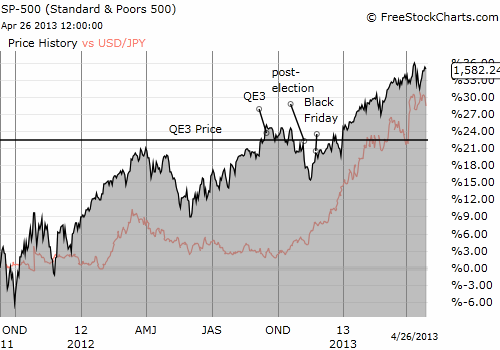
Ever since the S&P 500 rallied off the post-election lows last October, there has been a tight correlation between S&P 500 strength and Japanese yen weakness. This does NOT necessarily say that the carry trade – the borrowing of yen to purchase the S&P 500 – has lifted the stock market ever higher. The correlation between the yen and the S&P 500 was not high before the election; moreover, a lot of markets have gone higher over this time period, and it is not likely yen are being used to buy up all these markets.

A confirmed double-top in USD/JPY – a break below the low following the first top (around 96) – could impact trading psychology a lot, especially with May right around the corner. Seeing the S&P 500 struggle with printing fresh all-time highs will all but confirm for many traders that it is indeed time to “sell in May and go away.” I will be watching very carefully the behavior on both sides of the equation. The burden of proof rests firmly with the bulls now.
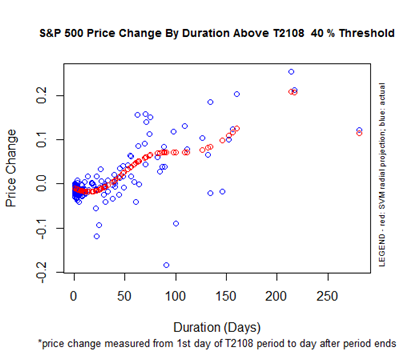
T2108 dropped for the first time since it printed a quasi-oversold condition over a week ago at 37.2%. Before this drop, an overbought condition for the coming week seemed all but certain. This is now the sixth day in the 40% “overperiod.”

This part of the new T2108 Model suggests that there is still a downward bias to trading IF T2108 drops below 40%. I ignored this possibility last week in order to pursue the bounce from quasi-oversold conditions as far as it would take me. The important lesson here as I continue to refine the model is that I cannot read too much into signals that do not provide a definitive recommendation. In the case of these over/under-periods, the prescription is conditioned on an event – the end of the period – that itself does not have a prediction model. I can use the mean duration of the T2108 40% over-period of just under 50 days and the median duration of around 10 days to trigger a FIRST bearish trade as the odds favor an end to the 40% over-period. But after the 50th trading day (10 weeks!) the bias must be bullish given the high likelihood that the S&P 500 will still provide positive returns when T2108 next drops below 40% (it of course somewhat depends on how large the S&P 500 gains get DURING the over-period). However, by then, I should find other over-periods much more informative (like 70% where T2108 will be officially overbought).
This complicated reality also creates the need for finding other prediction models that are at least as powerful as the quasi-oversold model. As always, stay tuned!
Daily T2108 vs the S&P 500

Black line: T2108 (measured on the right); Green line: S&P 500 (for comparative purposes)
Red line: T2108 Overbought (70%); Blue line: T2108 Oversold (20%)
Weekly T2108

*All charts created using freestockcharts.com unless otherwise stated
Related links:
The T2108 Resource Page
Expanded daily chart of T2108 versus the S&P 500
Expanded weekly chart of T2108
Be careful out there!
Full disclosure: long SSO calls, long USD/JPY
