For this chartfest, I do not have time to provide extensive commentary. So, this is mostly a visual presentation of the charts with some labels or notes to point your attention to what I think is most interesting from a trading perspective. Feel free to post questions if anything is not clear.
Enjoy…!
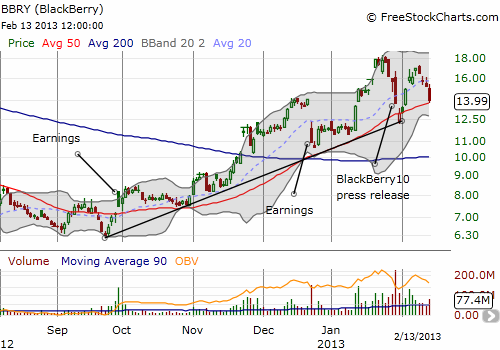
I have been keeping a closer eye on BlackBerry (BBRY) now that it has adopted upside momentum. Much to my surprise, it is already retesting that upward trend along with the steeply ascending 50DMA. Since the previous peak before this retest did not print a fresh high, I am not nearly as confident of this retest as I was with the former. So buyer beware. A break of support is likely a better bet from a risk/reward perspective.
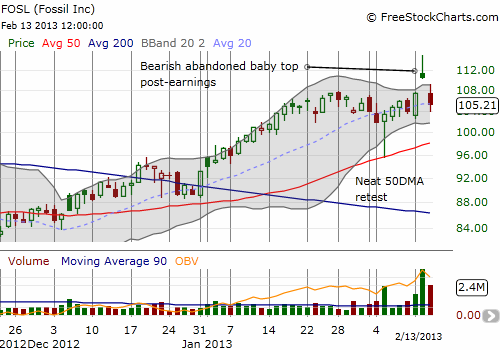
Fossil (FOSL) had a great earnings report on Tuesday, but suddenly on Wednesday, the stock has gapped back down. All the post-earnings gains are gone as fast as they came, leaving a bunch of trapped buyers in the dreaded abandoned baby pattern.
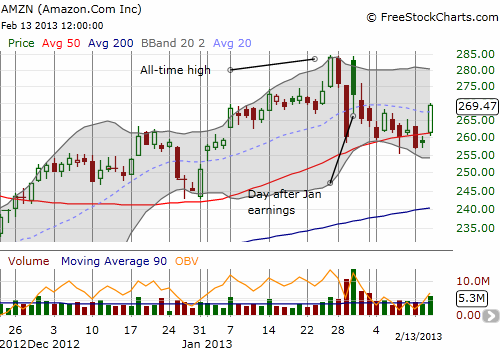
Amazon.com (AMZN) remains as stubborn as ever. I was looking for a continuation of the breakdown below the 50DMA. Instead, the stock is now bouncing strongly up and away from the 50DMA and using it as support.
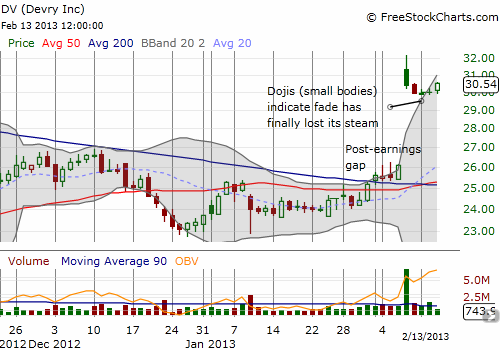
Devry (DV) had a good reaction to its earnings report last week with a large gap up. However, sellers took over from there until Wednesday. It now looks ready to resume the rally.
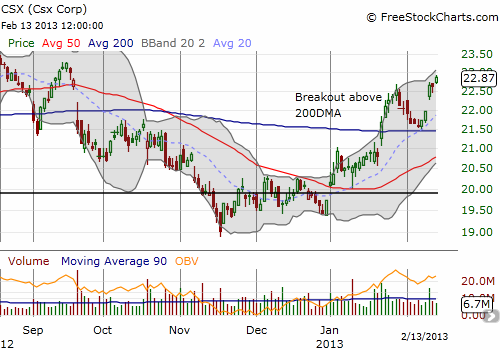
CSX Corporation (CSX) broke out above its 200DMA last month and made a picture-perfect retest that succeeded. After a post-earnings gap up, the stock looks ready to continue rallying from here.
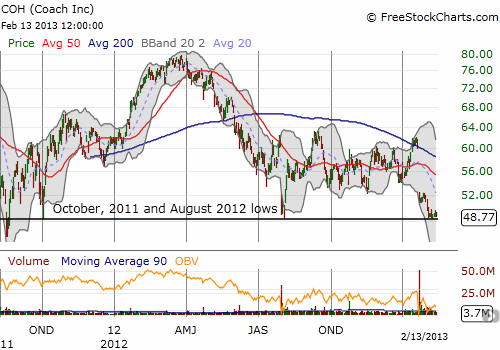
Coach (COH) is in trouble. Another poor earnings report has sent it dribbling downward to support that has held since 2011. Will the third time be a charm? So far, the stock has been extremely reluctant to dip below this support. But if it does, watch out… (I bought shares to play a bounce – I have not yet decided whether to abandon hope on a breakdown or buy puts and wait it out).
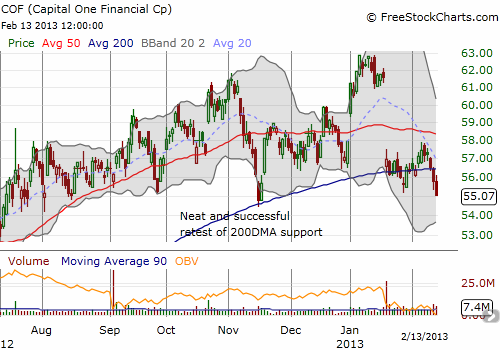
Capital One Financial is breaking down after a valiant post-earnings effort to hold support at the 200DMA. I am looking to get short here.
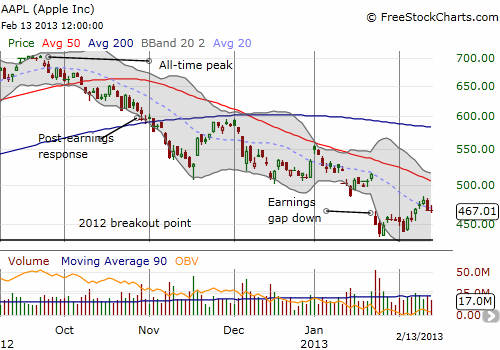
And what would a chartfest be without Apple (AAPL)? AAPL traded right to its 20DMA on Friday and has been unable to sustain a push away from this declining line all week. Given the 20DMA is still in a strong downtrend, I have to assume the current behavior confirms that the downtrend is alive and well. My first downside target was a modest $460 for the week. But any gap down Thursday or Friday morning should easily take AAPL to $450. Note how neatly AAPL held support at 2012’s breakout point (not shown on the graph). You just cannot make this stuff up!
Source: FreeStockCharts.com
Be careful out there!
Full disclosure: long calls and put spread on AMZN, long CSX, long COH, long AAPL shares, put and call spreads, long DV calls
