This is a chart review I should have written during the day Monday or at least Monday night. The drama could not be much higher immediately ahead of January earnings, and the stock is throwing up important trading signals.
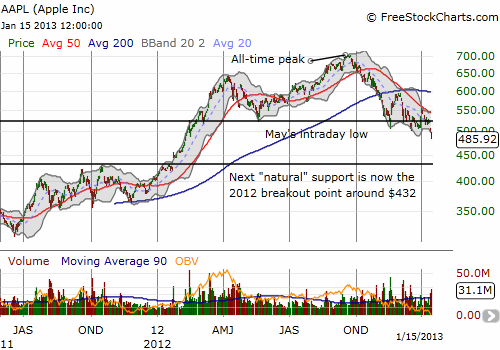
Apple (AAPL) gapped down on Monday morning and closed with a 3.5% loss on very heavy trading volume. This was a VERY bearish move as it came off what had become a pivot point around $523 which was the important intra-day low from last May. Typically, Apple starts the week strong and ends the week meekly, so I did not hesitate to buy puts on AAPL. On Tuesday, the expected follow-through occurred with Apple sliding down another 3.2%, again on very high volume, cracking $500 and hitting an 11-month low. This move further confirmed the downtrend that has been in place since AAPL broke below its 50DMA after just setting all-time highs. The charts below describe the short-term and long-term action.


Source: FreeStockCharts.com
The current breakdown now exposes Apple to the gap up in January, 2012 that started a tremendous, nearly non-stop run-up to what was then fresh all-time highs in April. AAPL even overcame what looked like at the time a bearish reversal. AAPL is currently trading just below the bottom of that move in February. The support at $432 that I have pointed to in previous posts is now back in play. This all comes at a time when the S&P 500 (SPY) remains extremely overbought. But this is where things get a little “complicated.”
First, during the day Tuesday, I noted (and tweeted) that during Apple’s current sell-off, the stock has traded below the lower-Bollinger Band (BB) six times. Four of these times, the stock has managed to hit the pause button on the selling. The most dramatic example of this occurred on November 16th when AAPL printed a long hammer that generated a sharp relief rally right to the 200DMA resistance right below $600. Apple traded marginally below the lower-BB on Monday but Tuesday was the real over-extension of the selling. If recent history holds, Wednesday should feature at least one day of rest from the selling…if not more. When I noticed this pattern, I sold my 485/475 put spread but kept my 460 put (all expiring this Friday). The far out-of-the-money put is a “just in case” AAPL’s slide accelerates quickly toward presumed support. The profits from the put spread paid for that put and then some.
Supporting the idea that AAPL has not just reached a pause in selling but a firm bottom is “market timer” Tom DeMark. He appeared on CNBC’s Fast Money to declare his short of AAPL over, and his transformation into an aggressive bull has begun.
I will not go into his methods here, but I give him credibility since he nailed the short call and held firm even through AAPL’s relief rallies. I always perk up and listen when contrarians switch their stance.
Also supporting a bottom is the nature of Monday’s angst. It was initiated by a story in the WSJ citing a story in Nikkei, a Japanese news source, that claimed the following:
“Japan Display Inc. and Sharp Corp. have started reducing production of smartphone liquid-crystal-display panels for Apple Inc. amid slower-than-anticipated global sales of the iPhone 5., the Nikkei reports in its Jan. 14 edition.”
My friend who sent me the dire news wondered aloud how it is the WSJ jumped to the conclusion that iPhone5 sales were poor. I wondered the same (it turns out unnamed sources made this claim..oh, of course!). He posed several good questions/points:
- How much of this is true; the WSJ cannot be trusted.
- How much has been circulating as rumors, and been the reason underlying AAPL weakness?
- The article does not address the possibility that Apple is shifting to a non-Japanese source; say, South Korean. Or that Apple needed to get to a certain inventory level and has done so, and these cutbacks were planned.
As this story made its rounds in the media, the conclusion that Apple’s iPhone 5 sales were weak took on a life of its own with seemingly few questioning the underlying premise. 140-character tweets referencing the story sure did not help. Reuters at least provided a much more complete and well-rounded story in “Apple cuts orders for iPhone 5 parts on weak demand: Nikkei.” While it attributed the conclusion of weak demand to Nikkei, the article at least found an analyst willing to consider other possibilities:
“‘”Our checks with supply chain contacts close to the situation identified a very different cause: a slower ramp in the manufacturing of iPhones and iPads (reflecting some quality control issues) and insufficient production lines,” said Joane Feeney of Longbow Research.'”
More importantly, Forbes writer Mark Rogowsky wrote an interesting piece titled “Why The WSJ Got The ‘iPhone Demand Is Crashing’ Story All Wrong.” In this article, he argues that numbers quoted for expected iPhone production were far too high to be credible:
“So no matter how strong iPhone 5 is selling, if the company needed 45 million screens last quarter, it would need fewer this quarter. How many? Perhaps 40 million or so. Of course, if Apple had ordered more than it needed last quarter to make sure that it was ahead of the game, it would need fewer still going into winter and might only require 30-35 million. The truth is, we don’t know,, but then neither does Nikkei, or its unnamed sources.
None of this stopped a credulous WSJ from running the story as front-page news just eight days ahead of Apple’s Jan. 23 earnings announcement. It’s pile-on season for the Cupertino, Calif. consumer-electronics giant, which has apparently “lost its edge” according to most everything you read these days. It’s an interesting spin given that the company sold 37 million iPhones in the holiday quarter this year and even the lowest end of the forecast would be a 20 percent boost to that number. (At 50 million, year-over-year growth would be 35 percent.)”
My point is that there is NO certainty in the conclusion that iPhone5 sales were poor; thus, the setup is here for a potential explosion upwards if either 1) the market concludes ahead of earnings that it has been misled and/or 2) Apple debunks everything with another blowout quarter and decent guidance. Moreover, the government reported retail sales much higher than expected for December – throwing just enough additional uncertainty in the conclusion that Apple uniquely suffered amidst a stronger than expect month for retail.
In my next post, I will be looking at the odds for a large post-earnings run-up for AAPL. I think it goes without saying that if AAPL drops a bomb about weak demand, the subsequent sell-off will likely take the stock immediately to presumed support at $432 and swiftly beyond. But thanks to all the selling that has preceded earnings, good news could have a similar impact going the other direction. In other words, January earnings should be explosive. In a coming post, I will do my traditional analysis of the post-earnings trade for AAPL.
Finally, here is a great tweet I found on Tuesday (Jan 15) that perfectly describes the dangers in over-loving momentum:
“@traderstewie – pull up weekly charts of $GOOG, $AMZN. Wall Street has this way of making u LOVE a stock at the top and hating it near the bottom. $AAPL”
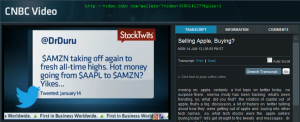
Speaking of tweets, I was of course tweeting about AAPL on Monday. My activity managed to catch the attention of Seema Mody on CNBC’s Fast Money. Seema pulled up the following from me:
“$AMZN taking off again to fresh all-time highs. Hot money going from $AAPL to $AMZN? Yikes…”
Here is the segment:
I also saved a screenshot of my 15 seconds of fame (click for larger view):

I thanked her for the mention, telling her it was both trippy and cool to see that. For the record, I was NOT taking my Apple money and buying Amazon.com (AMZN) shares and certainly not recommending anyone do that. I was speculating trying to explain the sharp divergence in behavior in the stocks. I also later tweeted this:
“$RIMM follows through with more strong buying as expected (see Friday tweets). But is hot money going from $AAPL to RIMM? Double yikes.”
Be careful out there!
Full disclosure: long AAPL shares and puts
