In numerous posts I have described the intriguingly consistent and profitable relationship between the Australian dollar (FXA) and the S&P 500 (for example, see “A Hypothesis for the Connection Between the Australian Dollar and the S&P 500“). In recent weeks, I have also noticed periodic patterns in the way the Australian dollar trades versus the S&P 500 (SPY) on an intra-day basis. I have tweeted my projections whenever the evidence seemed strong enough to make them. These projections have worked very consistently, but I have not used a quantified framework for making these projections. In this post, I quantify the intraday relationships between the Australian dollar, using the currency pair AUD/USD and the S&P 500, using the SPY ETF. I am focused on using AUD/USD as a trading signal for SPY and not the reverse. My analysis has produced the following conclusions:
- On the majority of days, once AUD/USD peaks, SPY has also peaked or will peak within an hour.
- On the majority of days, once AUD/USD hits bottom, SPY has also bottomed or will bottom within an hour.
- The intraday PATH of AUD/USD has a large impact on the relationship between the peaks and bottoms in AUD//USD and SPY. These relationships can be quantified, but they require an assessment of the likely path of AUD/USD.
- On the majority of days where AUD/USD hits its peak BEFORE its bottom for the day, SPY peaks after AUD/USD’s peak. Note how the path of AUD/USD radically alters the likely behavior of SPY from conclusion #1 above.
- On the majority of days where AUD/USD hits its peak before its bottom for the day, SPY peaks after AUD/USD bottoms AND SPY bottoms after AUD/USD bottoms. Combined with the previous conclusion, SPY can be bought after AUD/USD peaks assuming that a bottom has not yet occurred for AUD/USD. This buying signal is only valid for a very short period of time since SPY will likely soon descend just as AUD/USD did or will. In other words, this is a poor risk/reward trade.
- On the majority of days where AUD/USD hits its peak AFTER its bottom for the day, SPY peaks before AUD/USD peaks.
- On the majority of days where AUD/USD hits its peak after its bottom for the day, SPY bottoms no later than an hour after AUD/USD bottoms. This behavior means that SPY is a buy when AUD/USD is rising, assuming AUD/USD has already bottomed for the day.
- In other words, while AUD/USD is ascending during the day off its low of the day, SPY will most likely ascend as well. Once a trader concludes AUD/USD has hit a peak for the day, prepare to close out any bullish intraday SPY trades.
I have two favorite calls: bearish divergences and confirmations. Bearish divergences occur when the S&P 500 continues to trade higher even after the Australian dollar seems to have peaked or is even in decline at its lows for the day. Typically, the S&P 500 eventually follows the Australian dollar downward, but there have been occasions where the Australian dollar achieved the turnaround. Confirmations occur when the S&P 500 makes new highs or lows on the day along with the Australian dollar making similar moves. The timing of these ebbs and flows is never exact but usually “close enough.”
To analyze the quantitative basis for these observations, I examined the hourly data for AUD/USD and SPY from June 5, 2012 to September 14, 2012. Conveniently, this covers the period since the major bottom in financial markets on June 1, 2012. Thus, this analysis covers a very bullish period of recovery for the markets where we would expect an overall upward bias in both SPY and AUD/USD. In other words, it is a period of time when we should expect relatively high correlations across risk assets, especially with central banks promising to backstop growth with printing money, buying bonds, etc… While I suspect that this analysis applies whether the market is in recovery or selling off, I cannot conclude this is the case without more data.
I used About Currency to get historical hourly data for the Australian dollar. I used FreeStockCharts.com for hourly data on the S&P 500. I prefer 30-minute intervals but using a shorter interval would have further limited the number of days available to analyze from these data sources. The currency data in particular limit me to 72 trading days and seven (hourly) data points per day. This also means I only have five data points that are inside the trading day.
I use charts as a convenient visual device to make the relationships clear. In each chart, I calculate the length (or duration) of the gap between price milestones – maximums (or peaks) and minimums (or bottoms) – using SPY’s milestone as the starting point in the calculation. These gaps are measured in whole hours as the times are reported in whole hours in the data. Unfortunately, I found that FreeStockCharts.com data can change its measured open, close, low, and high depending on the selected time frame. I am assuming these issues are consistent across the entire set of data. A positive “hours difference” means that SPY achieved its price milestone AFTER the price milestone for AUD/USD. A negative hours difference means that SPY achieved its price milestone BEFORE the price milestone for AUD/USD. When the hours difference is zero, it is not possible to determine the ordering of the milestones.
The y-axis on the graphs measures the number of occurrences of each of the hours differences. These totals are also shown above each bar for clarity. I include cumulative stats that I find interesting and informative.
After excluding days where either AUD/USD and/or SPY achieved maximums and minimums on the day in the same hour, I am left with 69 trading days. In two cases, I had to throw out two bad data points.
Finally, here are the charts:
{Max = maximum; min = minimum. “Strictly before” and “strictly after” measure before and after the zero hours difference respectively.}
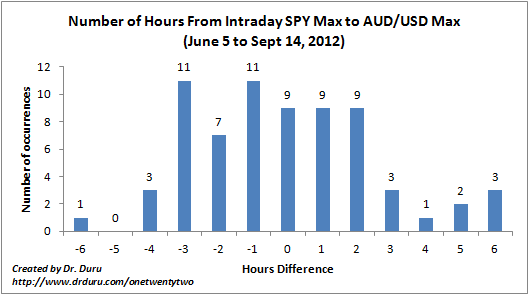
The max for SPY occurs strictly before the max for AUD/USD 48% of the time. The max for SPY occurs strictly after the max for AUD/USD 39% of the time. This behavior means that on the majority of days, once AUD/USD peaks, SPY has also peaked or will peak within an hour.
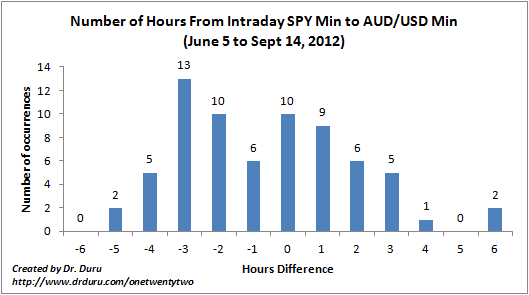
The min for SPY occurs strictly before the min for AUD/USD 52% of the time. The min for SPY occurs strictly after the min for AUD/USD 33% of the time. This behavior means that on the majority of days, once AUD/USD hits bottom, SPY has also bottomed or will bottom within an hour.
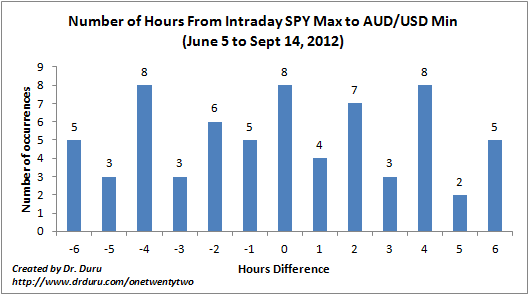
The max for SPY occurs strictly before the min for AUD/USD 45% of the time. The max for SPY occurs strictly after the min for AUD/USD 43% of the time. These data suggest the relationship between the SPY max and the AUD/USD is inconclusive.
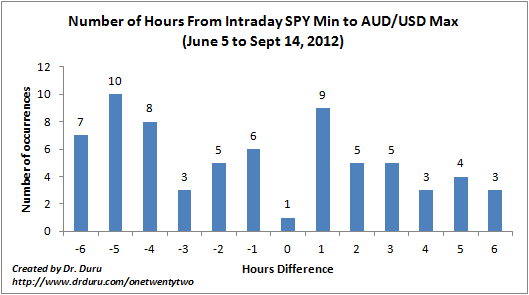
The min for SPY occurs strictly before the max for AUD/USD 57% of the time. The min for SPY occurs strictly after the max for AUD/USD 42% of the time. This behavior means that on the majority of days, once AUD/USD peaks, SPY has already hit its bottom. Note carefully that this cannot be used as a SPY buy signal since it does not mean SPY will rise any further.
The trading relationships between SPY max/min and AUD/USD max/min become even more apparent once the data are distinguished by the path traveled by AUD/USD over the course of the trading day. In the next charts, I divide each data set by whether the peak for AUD/USD occurs before or after its bottom for the day.
When AUD/USD hits its peak (max) BEFORE it hits its bottom (min) for the day, I call this an AUD/USD descending day…
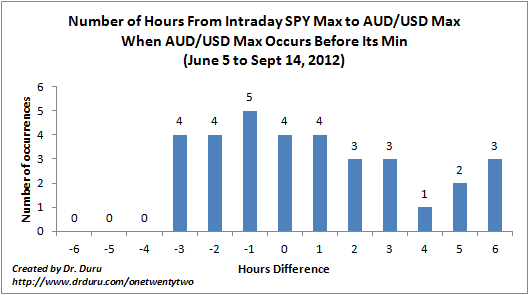
On an AUD/USD descending day, the max for SPY occurs strictly before the max for AUD/USD 39% of the time. The max for SPY occurs strictly after the max for AUD/USD 48% of the time. This behavior means that on the majority of AUD/USD descending days, SPY’s peak occurs after AUD/USD peaks.
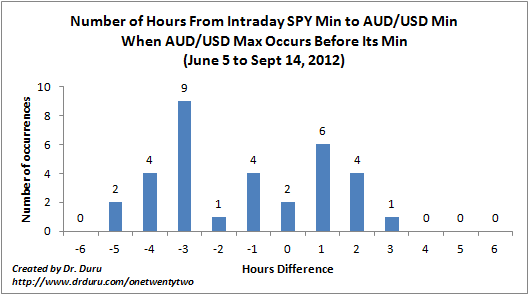
On an AUD/USD descending day, the min for SPY occurs strictly before the min for AUD/USD 61% of the time. The min for SPY occurs strictly after the min for AUD/USD 33% of the time. This behavior means that on the majority of AUD/USD descending days, SPY’s min occurs before AUD/USD hits a bottom. Note that a bottom for AUD/USD is not necessarily a buy signal for SPY since SPY will not necessarily rise any further.
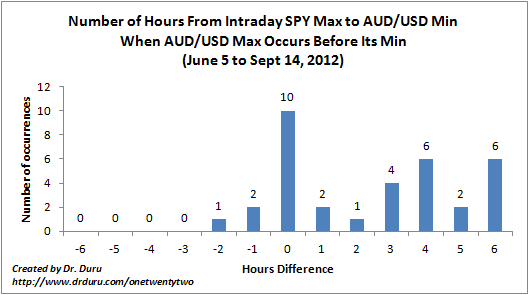
This chart surprised me, but it provides some valuable insight. On an AUD/USD descending day, the max for SPY occurs strictly before the min for AUD/USD only 9% of the time. The max for SPY occurs strictly after the min for AUD/USD 62% of the time. This behavior means that on the majority of AUD/USD descending days, SPY’s peak occurs after AUD/USD bottoms. This relationship surprised me because it means that a bottom in AUD/USD IS a buying signal for SPY!
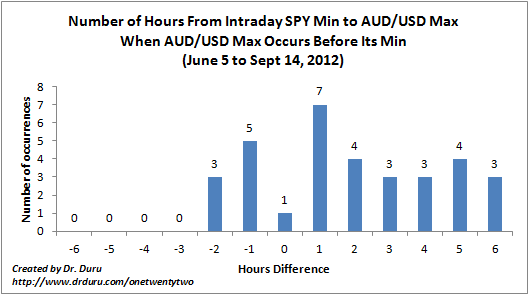
This chart also surprised me, but, again, it provides some valuable insight. On an AUD/USD descending day, the min for SPY occurs strictly before the max for AUD/USD only 24% of the time. The min for SPY occurs strictly after the max for AUD/USD 73% of the time. This behavior means that on the majority of AUD/USD descending days, SPY’s bottom occurs after AUD/USD peaks. Combined with the previous conclusion, it means that the buying signal for SPY after AUD/USD peaks is valid for only a short period of time.
When AUD/USD hits its peak (max) AFTER it hits its bottom (min) for the day, I call this an AUD/USD ascending day…
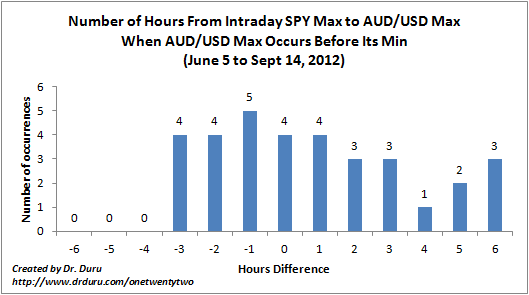
On an AUD/USD ascending day, the max for SPY occurs strictly before the max for AUD/USD 56% of the time. The max for SPY occurs strictly after the max for AUD/USD 31% of the time. This behavior means that on the majority of AUD/USD ascending days, SPY’s peak occurs before AUD/USD peaks. This means that a peak in AUD/USD signals a peak in SPY on an AUD/USD ascending day.
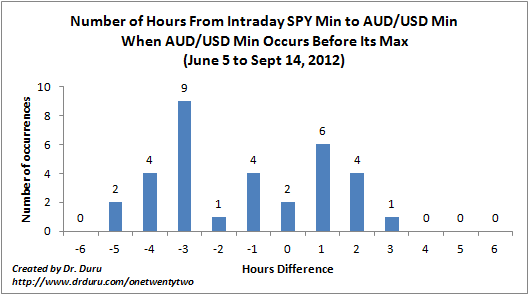
On an AUD/USD ascending day, the min for SPY occurs strictly before the min for AUD/USD 44% of the time. The min for SPY occurs strictly after the min for AUD/USD 33% of the time. This behavior means that on the majority of AUD/USD ascending days, SPY’s bottom occurs no later than one hour after AUD/USD bottoms.
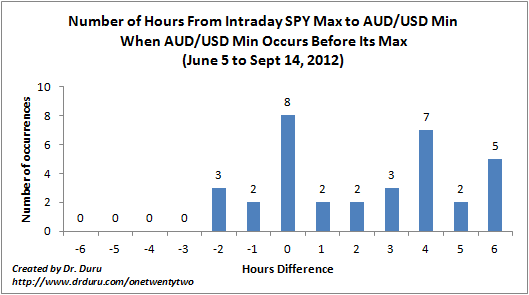
On an AUD/USD ascending day, the max for SPY occurs strictly before the min for AUD/USD only 15% of the time. The max for SPY occurs strictly after the min for AUD/USD 62% of the time. This behavior reinforces the message of the previous conclusions: buy SPY if AUD/USD is ascending off its bottom for the day.
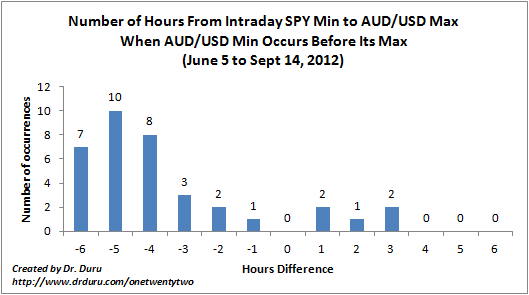
On an AUD/USD ascending day, the min for SPY occurs strictly before the max for AUD/USD 86% of the time. The min for SPY occurs strictly after the max for AUD/USD only 14% of the time. This behavior confirms that SPY will most likely ascend during the trading day while AUD/USD ascends.
Overall, this analysis has greatly clarified the conditions under which I can make intraday projects about SPY based on the intraday behavior of AUD/USD. The trick going forward will be to consistently apply these rules in a way that actually beats the more intuitive approach that I have now. I will revisit this analysis after I can collect data during a different kind of market.
Be careful out there!
Full disclosure: short AUD/USD, long SSO calls

GOOD STUFF, WILL DIGEST AFTER MKT.WORKING ON A SIMILAR PROJECT FOR 18YRS, REFUSE TO DIVULGE COMPONENTS,BUT ON A DAILY BASIS, WILL SHARE DATA OUTCOMES,FOR $SPX & $COMP MOVEMENTS,USING $SP #F & $ND #F AS BASE.
Great. I appreciate anything you can share. Thanks for reading.