(T2108 measures the percentage of stocks trading above their respective 40-day moving averages [DMAs]. It helps to identify extremes in market sentiment that are highly likely to reverse. To learn more about it, see my T2108 Resource Page. You can follow real-time T2108 commentary on twitter using the #T2108 hashtag. T2108-related trades and other trades are posted on twitter using the #120trade hashtag)
T2108 Status: 67.7%
VIX Status: 17.1
General (Short-term) Trading Call: Hold.
Reference Charts (click for view of last 6 months from Stockcharts.com):
S&P 500 or SPY
SDS (ProShares UltraShort S&P500)
U.S. Dollar Index (volatility index)
VIX (volatility index)
VXX (iPath S&P 500 VIX Short-Term Futures ETN)
EWG (iShares MSCI Germany Index Fund)
CAT (Caterpillar)
Commentary
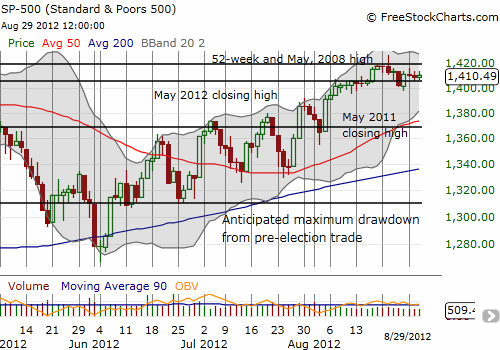
Last week, the Pavlovian market jumping at another mention of old QE3 news. This week, the Pavlovian market anxiously awaits word from Jackson Hole, Bernanke’s word specifically. For three straight days the S&P 500 has swung in a tight range directly above support from the May, 2012 high. Directly above is the tantalizing line of resistance from 52-week highs which remains the bearish scene of a false breakout.

T2108 is also going nowhere, remaining between 65% and 69% since dropping out of overbought conditions a week ago.
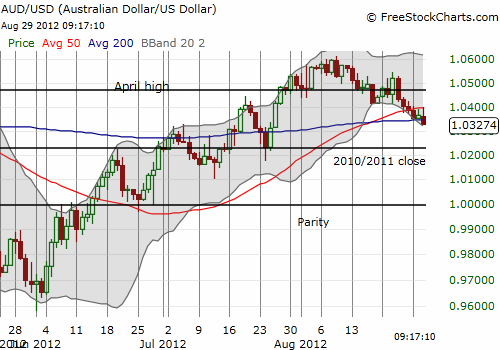
The VIX however is NOT sitting still. At 17 now, the VIX has steadily risen in a straight line from its lows on August 17th at 13.4. I am interpreting this move bearishly given the Australian dollar continues to break down. I have written numerous times demonstrating the convenient relationship between the Australian dollar and the S&P 500. Today, the bearish divergence rose its ugly head again as AUD/USD slid below its 200DMA, confirming the breakdown from the 50DMA just on Monday.

Given these technical setups, Jackson Hole could indeed deliver another one of those critical junctures, whether up or down. For the Australian dollar, I am making a small bet that it has one more bounce left before dropping back to parity against the U.S. dollar. For the S&P 500, it is wait and see until support or resistance next breaks…and of course, since I think the Australian dollar will continue to slide downward, I think the S&P 500 will eventually “have to” follow as well.
Daily T2108 vs the S&P 500
Click chart for extended view with S&P 500 fully scaled vertically (updated at least once a week)

Black line: T2108 (measured on the right); Green line: S&P 500 (for comparative purposes)
Weekly T2108

*All charts created using freestockcharts.com unless otherwise stated
Related links:
The T2108 Resource Page
Expanded daily chart of T2108 versus the S&P 500
Expanded weekly chart of T2108
Be careful out there!
Full disclosure: long SSO puts, net long Australian dollar
