(T2108 measures the percentage of stocks trading above their respective 40-day moving averages [DMAs]. To learn more about it, see my T2108 Resource Page. You can follow real-time T2108 commentary on twitter using the #T2108 hashtag. T2108-related trades and other trades are posted on twitter using the #120trade hashtag)
T2108 Status: 73.6% (second day of fifth overbought period since June 29)
VIX Status: 14.3
General (Short-term) Trading Call: Hold.
Reference Charts (click for view of last 6 months from Stockcharts.com):
S&P 500 or SPY
SDS (ProShares UltraShort S&P500)
U.S. Dollar Index (volatility index)
VIX (volatility index)
VXX (iPath S&P 500 VIX Short-Term Futures ETN)
EWG (iShares MSCI Germany Index Fund)
CAT (Caterpillar)
Commentary
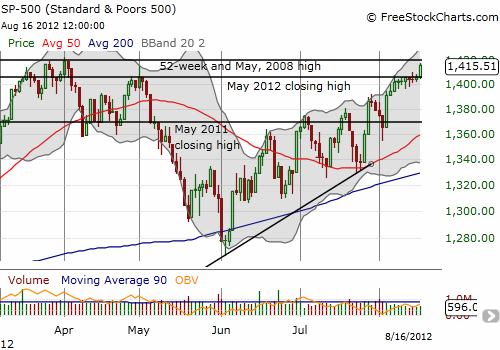
All that pressure that was building up in the previous overbought period finally got released today. As I mentioned earlier, despite the declining volume, the path of least resistance is up and that showed as today’s breakout came on low volume.

T2108 did not leap as far as I would have expected on such a day, only moving 3 percentage points from marginally overbought. I will be looking for T2108 to ramp toward 80% to confirm the strength of any fresh multi-year breakout. Such a rally will need broad participation.
As a reminder, I will switch to an aggressive, “buy-the-dip” strategy only once a breakout is confirmed: first a close to new highs and then follow-through with a higher close. This reduces the odds of getting caught in a headfake. I will switch from buying SSO puts to fade rallies to buying calls on dips (including intraday). This strategy worked well in March. I will also salvage what I can from SDS and transfer that cash to AdvisorShare Active Bear ETF (HDGE) for a long-term backstop for an otherwise bullish bias. I have already dumped my holdings in ProShares UltraShort MSCI Europe (EPV) and bought calls in Siemens Atkins (SI) for good measure!
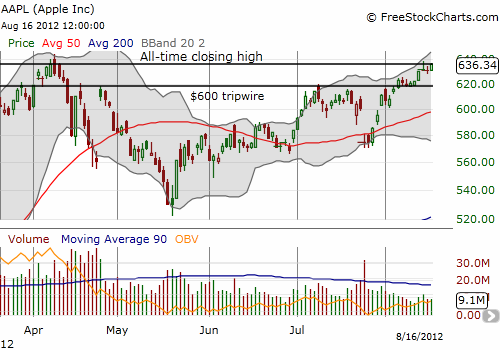
I think on an occasion like this, it is appropriate to roll out a chart of Apple (AAPL). Last week, Apple broke out in convincing fashion. Today, in what I can only call one of those teases you have to see to believe, Apple closed exactly at its all-time closing high. Note that when this high was printed on April 9th, 2012, AAPL opened higher the next day only to close down on the day. That bearish move was the beginning of AAPL’s quick swoon to May lows. You can bet, I, and many other technicians will be following AAPL’s behavior even more closely from here…

Daily T2108 vs the S&P 500
Click chart for extended view with S&P 500 fully scaled vertically (updated at least once a week)

Black line: T2108 (measured on the right); Green line: S&P 500 (for comparative purposes)
Weekly T2108

*All charts created using freestockcharts.com unless otherwise stated
Related links:
The T2108 Resource Page
Expanded daily chart of T2108 versus the S&P 500
Expanded weekly chart of T2108
Be careful out there!
Full disclosure: long SDS; long SSO puts; long VXX shares; short VXX calls; long SI calls and puts
