(T2108 measures the percentage of stocks trading above their respective 40-day moving averages [DMAs]. To learn more about it, see my T2108 Resource Page. You can follow real-time T2108 commentary on twitter using the #T2108 hashtag. T2108-related trades and other trades are posted on twitter using the #120trade hashtag)
T2108 Status: 58.8% (first day of a new overbought period)
VIX Status: 17.6
General (Short-term) Trading Call: Close out some bearish trades. Otherwise hold.
Reference Charts (click for view of last 6 months from Stockcharts.com):
S&P 500 or SPY
SDS (ProShares UltraShort S&P500)
U.S. Dollar Index (volatility index)
VIX (volatility index)
VXX (iPath S&P 500 VIX Short-Term Futures ETN)
EWG (iShares MSCI Germany Index Fund)
CAT (Caterpillar)
Commentary
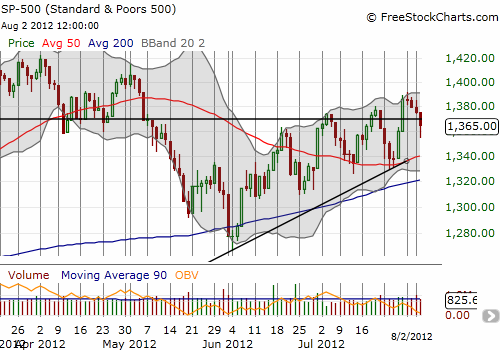
The S&P 500’s fade from the top of the uptrending channel continued today. T2108 dropped all the way to 58.8% as the S&P 500 lost 0.75%. At one point, the index had lost 1.2% which completed the reversal of last Friday’s impressive gains. The rally into the close returned some of those gains, but the S&P 500 still closed below resistance.

In my last T2108 Update, I expressed my worry that the previous overbought period did not end as well as the previous two in terms of generating profits on the bearish side. So, I was mentally unprepared when the open delivered the perfect gap down that put my SSO puts expiring on Friday into the green. As I watched the classic gap reversal unfold, I also watched the Australian dollar versus the U.S. dollar (AUD/USD). I noticed the currency pair struggling and surmised that the S&P 500 would soon stall out. I took the big risk of adding to my losing position, set a limit order to unload the puts at a decent profit, and sighed in relief when I found later in the day that the order executed as the S&P 500 made a fresh intraday low.
I then tweeted “$AUDUSD is so far NOT confirming new low on the day for $SPY. However, BOTH have now broken below breakout points on daily.” Almost on cue, the S&P 500 rallied into the close. Yes, the Australian dollar remains a very critical gauge of intra-day and daily market direction.
In the strange department, the volatility index not only faded from its marginal highs on the day, it finished down with a very weak close. The VIX closed down 7.3% in what seems to be a harbinger for a muted to strong (meaning positive) response to Friday’s U.S. employment report. I will be watching eagerly to see whether the VIX can provide advanced signals for important episodic catalysts (to be clear, this would be a gauge of the market’s likely RESPONSE to the news and not a predictor of the news itself). The VIX faded yet again from the 50DMA which is now declining…suggesting more declines are right around the corner.
Finally, Caterpillar, Inc. (CAT) managed to close UP on the day although this was a fade from higher levels. Another small positive for a topsy-turvy day.
Daily T2108 vs the S&P 500
Click chart for extended view with S&P 500 fully scaled vertically (updated at least once a week)

Black line: T2108 (measured on the right); Green line: S&P 500 (for comparative purposes)
Weekly T2108

*All charts created using freestockcharts.com unless otherwise stated
Related links:
The T2108 Resource Page
Expanded daily chart of T2108 versus the S&P 500
Expanded weekly chart of T2108
Be careful out there!
Full disclosure: long SDS; long SSO puts; long CAT shares and calls
