(T2108 measures the percentage of stocks trading above their respective 40-day moving averages [DMAs]. To learn more about it, see my T2108 Resource Page. You can follow real-time T2108 commentary on twitter using the #T2108 hashtag. T2108-related trades and other trades are posted on twitter using the #120trade hashtag)
T2108 Status: 65.3% (first day of a new overbought period)
VIX Status: 19
General (Short-term) Trading Call: Hold.
Reference Charts (click for view of last 6 months from Stockcharts.com):
S&P 500 or SPY
SDS (ProShares UltraShort S&P500)
U.S. Dollar Index (volatility index)
VIX (volatility index)
VXX (iPath S&P 500 VIX Short-Term Futures ETN)
EWG (iShares MSCI Germany Index Fund)
CAT (Caterpillar)
Commentary
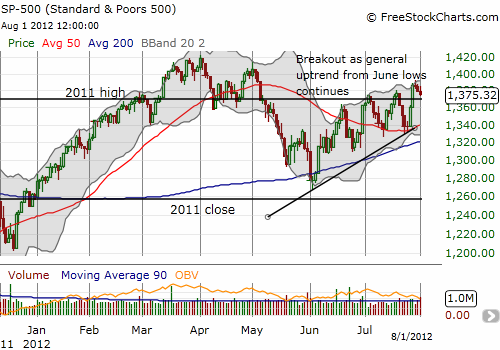
T2108 fell out of overbought territory after a 3-day stint. Unlike the previous two overbought trips, this one did not provide a perfect opportunity to fade from resistance. On the other hand, the end of the overbought period did not bring the S&P 500 to natural support. The first firm support should be just a few points away around 1369, the 2011 high. I will look to dump my latest round of SSO puts around there, and hopefully for near breakeven.

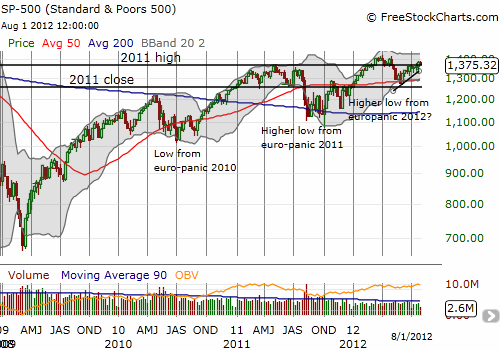
So, for now, little has changed in the bullish outlook. The persistent grinding upward, the higher highs and higher lows, the continued push into overbought territory all continue to display the relative strength of the buyers. In case you think the eurozone sovereign debt crisis remains a clear and present danger to the U.S. stock market, I present this weekly chart as a reminder that the S&P 500 in general is printing higher highs and higher lows after each episode of europanic.

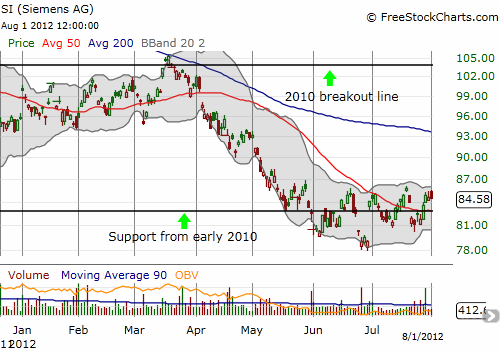
I did take the opportunity to unload my shares in Siemens (SI) (my europanic contrarian play). It is at the top of its trading range, and I did not feel comfortable holding it through the Federal Reserve latest announcement on monetary policy.

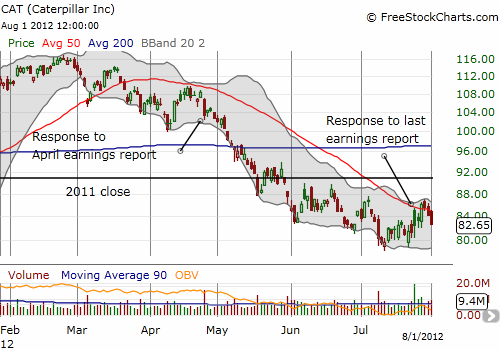
Finally, Caterpillar (CAT) has moved from a promising breakout above its 50DMA to a disappointing return to its pre-earnings closing price. I was looking to CAT as the final piece in the puzzle of starting an extended overbought rally. Back to the drawing board for now!

Daily T2108 vs the S&P 500
Click chart for extended view with S&P 500 fully scaled vertically (updated at least once a week)

Black line: T2108 (measured on the right); Green line: S&P 500 (for comparative purposes)
Weekly T2108

*All charts created using freestockcharts.com unless otherwise stated
Related links:
The T2108 Resource Page
Expanded daily chart of T2108 versus the S&P 500
Expanded weekly chart of T2108
Be careful out there!
Full disclosure: long SDS; long SSO puts; long CAT
