(T2108 measures the percentage of stocks trading above their respective 40-day moving averages [DMAs]. To learn more about it, see my T2108 Resource Page. You can follow real-time T2108 commentary on twitter using the #T2108 hashtag. T2108-related trades and other trades are posted on twitter using the #120trade hashtag)
T2108 Status: 33.4%
VIX Status: 20.4
General (Short-term) Trading Call: Hold with bearish hedges
Reference Charts (click for view of last 6 months from Stockcharts.com):
S&P 500 or SPY
SDS (ProShares UltraShort S&P500)
U.S. Dollar Index (volatility index)
VIX (volatility index)
VXX (iPath S&P 500 VIX Short-Term Futures ETN)
EWG (iShares MSCI Germany Index Fund)
CAT (Caterpillar)
Commentary
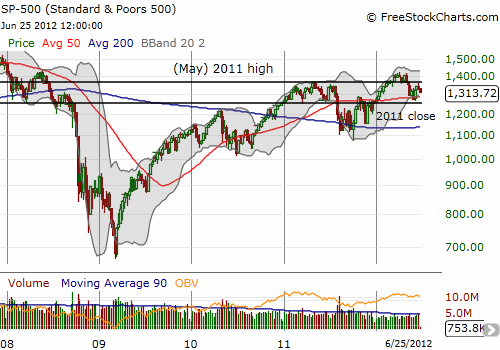
Hopefully those bearish hedges came in handy, and you even took some profits off the table. (I sold some VXX shares and even used the profits to buy VXX PUTS). T2108 dropped back to the bottom of the recent range as the S&P 500 lost 1.6%. The index experienced strong follow-through selling. Another day like Monday delivers a retest of the 200DMA. Given the market is still in churn mode, I decided to zoom out for some perspective. The weekly chart shows that the range lines I have drawn have some meaning beyond 2011. Notice that the 2011 close sits right on the ledge from which Lehman tipped over the S&P 500.

The VIX traded briefly above the critical 21 level only to glide underneath again. So the VIX remains a last key to the puzzle as to whether we are in for a deeper and longer sell-off.
Finally, it goes without saying that the industrial and cyclical stocks that are all waving red flag warnings fared poorly in Monday’s sell-off. Siemens AG (SI) is in particularly dire trouble. It has again broken through support that held so well since 2010 as it gapped down on Monday. I went ahead and bought puts on the stock to offset the calls.
Nothing has changed in my assessment of the market’s likely direction. That is, I remain short-term neutral. I will not get too excited about any particular move in the market until it delivers a clean breakdown or breakout from the current range of churning.
Daily T2108 vs the S&P 500

Black line: T2108 (measured on the right); Green line: S&P 500 (for comparative purposes)
Weekly T2108

*All charts created using freestockcharts.com unless otherwise stated
Related links:
The T2108 Resource Page
Expanded daily chart of T2108 versus the S&P 500
Expanded weekly chart of T2108
Be careful out there!
Full disclosure: long SDS, SSO; long VXX calls, puts, and shares; long SI calls and puts
