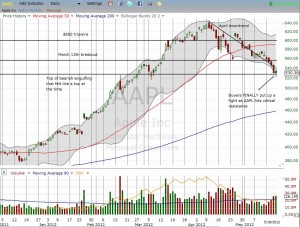
After gaining as much as 55% this year, sellers have peeled Apple (AAPL) back to a year-to-date gain of 31%. Certainly much better than the average stock, but it still represents a large loss from the highs. An index that falls this much from highs is considered to be in a bear market!
In my last AAPL chart review, I emphasized the importance of various critical support levels. Apple crashed through the March 13th breakout point. This support line had already been tested successfully right before earnings. Apple’s descent may have finally slowed at the next critical support level. Buyers finally put up a fight around $530 which marks the top of the bearish engulfing pattern from February. This level was successfully tested in March while Apple’s short-term uptrend remained intact.
Click image for a larger view:

Source: FreeStockCharts.com
The one feature of today’s trading (Friday, May 18th) that I do not like is that AAPL gained as much as 2% before fading to near flat. The top for the day perfectly coincided with the downtrend line. It is a warning signal that says buyers still may not quite have enough interest and staying power to support the stock. For now, I will see the glass half full and declare a partial victory for Apple buyers who finally put up a bit of a fight in the midst of this nearly non-stop drubbing.
Also note that volume surged the past two days in a near stalemate between sellers and buyers. This also works in Apple’s favor in at least putting a pause to the downward momentum. A successful defense of this line could be very significant for Apple’s short-term prospects. Here is an updated chart to describe the current technical setup. The very first hurdle is to just surpass the brief highs from Thursday. Breaking above the resistance at the March 13th breakout point would break the current downtrend and open up more upside possibilities.
I post these charts as a continuing demonstration of the importance of technicals for understanding short-term (and sometimes long-term stock movements). In Apple’s case, the steep downtrend from the April highs remains the most salient feature of the chart. If you are a trader, you must trade that trend until it fails. (CAREFUL! The general market is oversold now and primed for a strong bounce at a moment’s notice). Even when Apple finally rallies, it will face stiff resistance from sellers who are relieved to get better prices. Apple will face resistance at every previous support level, and the 50-day moving average (DMA) will provide the stiffest resistance as it starts to turn downward. In other words, the road ahead will be rough!
Be careful out there!
Full disclosure: long AAPL calls and puts
