(T2108 measures the percentage of stocks trading above their respective 40-day moving averages [DMAs]. To learn more about it, see my T2108 Resource Page. You can follow real-time T2108 commentary on twitter using the #T2108 hashtag. T2108-related trades and other trades are posted on twitter using the #120trade hashtag)
T2108 Status: 41%
VIX Status: 16.7%
General (Short-term) Trading Call: Hold. (click here for a trading summary posted on twitter)
Reference Charts (click for view of last 6 months from Stockcharts.com):
S&P 500 or SPY
SDS (ProShares UltraShort S&P500)
U.S. Dollar Index (volatility index)
VIX (volatility index)
VXX (iPath S&P 500 VIX Short-Term Futures ETN)
EWG (iShares MSCI Germany Index Fund)
CAT (Caterpillar)
Commentary
This update is late given the Friday trading holiday and global stock market weakness in the wake of disappointing U.S. unemployment numbers, so I will keep it short.
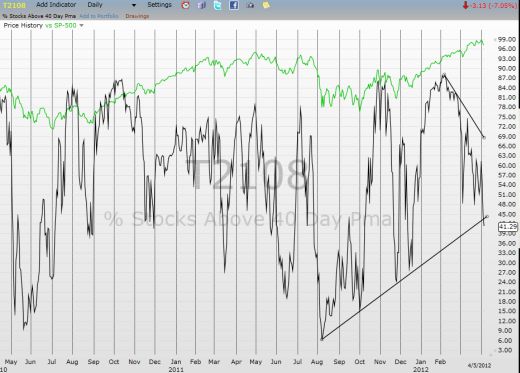
T2108 marginally broke the uptrend in place since the August lows.

This further weakens the case that T2108 will print overbought before it prints oversold. In fact, T2108 is now closer to oversold (20%) than to overbought (70%). Any trader wanting to use this information to short the market will be relieved to find that the S&P 500 remains just 1.5% off its recent multi-year highs – plenty of time and space for shorts. One could even argue that T2108 is creating a bearish divergence with the much slower S&P 500. HOWEVER, given the context of the last extended overbought period, I believe instead this divergence demonstrates the persistent strength in the index. I think it is entirely possible that an oversold T2108 may only drive the S&P 500 to a near reversal of March 13th’s big breakout move and still preserve what is starting to look like a growing consolidation pattern.
The Japanese yen is also starting to flag some bearish signals. I cover some esoteric aspects of this signal in “Bearish Implications Of A Rare Convergence Of Extremes In Yen Vs. S&P 500 Correlations.” The yen’s weakness seems to be ending and with it looms the potential that the “risk on” bias of the stock market is fading. Finally, as I noted in an earlier post, “sell in May” now looms over the horizon, especially for anyone anxious to preserve profits from the previous rally.
In other words, the dominoes are starting to line up for the bears. Soon, it will be the turn of the bulls to prove their case. If this sets up a visit to oversold territory, I will consider myself lucky…I will have the strongest reason in a long time to increase bullish trading positions. In the meantime, I have switched the trading call back to a hold (assuming a bearish hedge is still in place) to reflect the end of aggressive buying of SSO calls on market dips until T2108 turns oversold and/or the S&P 500 experiences a particularly sharp drop.
CAT-watch: Still holding March’s lows.
Charts below are the latest snapshots of T2108 (and the S&P 500)
Refresh browser if the charts are the same as the last T2108 update.
Black line: T2108 (measured on the right); Green line: S&P 500 (for comparative purposes)
Weekly T2108

*All charts created using freestockcharts.com unless otherwise stated
Related links:
The T2108 Resource Page
Expanded daily chart of T2108 versus the S&P 500
Expanded weekly chart of T2108
Be careful out there!
Full disclosure: long SDS; long SSO calls; long VXX calls and puts; long CAT shares and puts

