(T2108 measures the percentage of stocks trading above their respective 40-day moving averages [DMAs]. To learn more about it, see my T2108 Resource Page. You can follow real-time T2108 commentary on twitter using the #T2108 hashtag. T2108-related trades and other trades are posted on twitter using the #120trade hashtag)
T2108 Status: 68% (almost overbought)
VIX Status: 31 (still in trading range)
General (Short-term) Trading Call: Identify bearish plays, prepare to sell some bullish plays
Commentary
T2108 surged 12 percentage points to 68%. It is now on the edge of overbought territory starting at 70%. I consider this “close enough” to declare victory on my stubbornly persistent forecast that T2108 would hit overbought territory before hitting oversold.
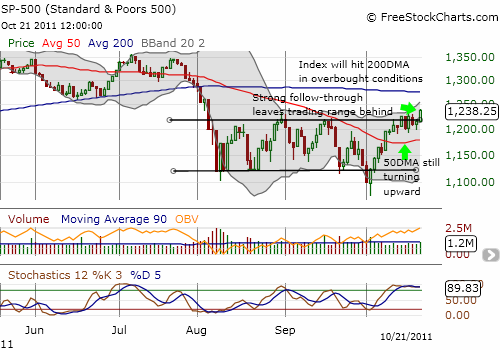
The S&P 500 jumped 1.9% to fresh 2 1/2 month highs. With buying volume perking up, I consider this move a strong follow-through on the breakout that the index has experienced in slow motion. Believe it or not, the index is well on its way to erasing all the panic, fear, and hand-wringing that has worn down sentiment since late July. The next challenge will be the 200DMA.

I now add this breakout to the list of bullish factors supporting more upside: a 50DMA turning upward and a still increasing on-balance volume (which is now at pre-selloff levels). I consider the previous trading range officially over. Accordingly, I will NOT get aggressive about bearish plays if/when T2108 hits overbought levels this week. I will patiently wait for a test of the 200DMA resistance. Even then, my projected downside will go no further than a retest of the increasingly bullish 50DMA.
Interestingly, the VIX is still within the confines of the previous trading range. VXX is resting on its 50DMA again. In other words, volatility is stubbornly hanging around and telling us to expect more wild swings.
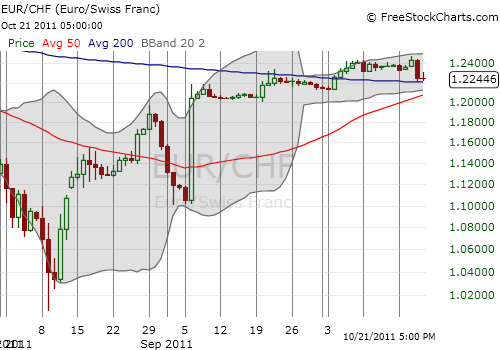
So what of the Swiss franc that had me worried on Friday? Well, the Swiss franc failed to follow-through on its surge Thursday evening. EUR/CHF remains perched atop the 200DMA, leaving the path forward ambiguous. Until this point of support breaks, Thursday’s surge remains ominous but not quite bearish. I will continue to watch this currency pair closely.

Charts below are the latest snapshots of T2108 (and the S&P 500)
Refresh browser if the charts are the same as the last T2108 update.
Black line: T2108 (measured on the right); Green line: S&P 500 (for comparative purposes)
Weekly T2108

*All charts created using freestockcharts.com unless otherwise stated
Related links:
The T2108 Resource Page
Expanded daily chart of T2108 versus the S&P 500
Expanded weekly chart of T2108
Be careful out there!
Full disclosure: long SSO, long puts on VXX, short EUR/CHF

