(T2108 measures the percentage of stocks trading above their respective 40-day moving averages [DMAs]. To learn more about it, see my T2108 Resource Page. You can follow real-time T2108 commentary on twitter using the #T2108 hashtag.)
T2108 Status: 15% (1st day of oversold conditions)
VIX Status: 45
General (Short-term) Trading Call: Oversold trading rules have triggered. Start closing out bearish trades. Aggressive traders start buying. Conservative traders wait to buy until the VIX jumps 20% or T2108 leaves oversold conditions, whichever comes first. More details below.
Commentary
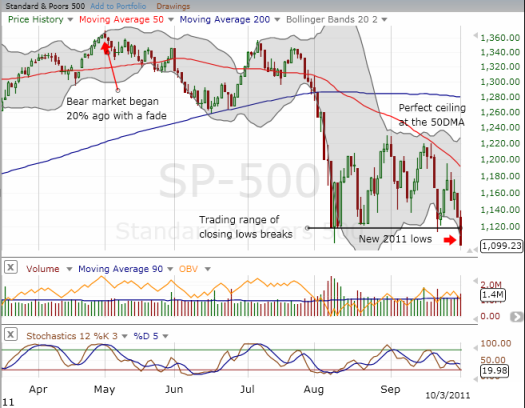
Welcome to the bear market. The S&P 500‘s new 52-week low printed a hair below 1100 and generated a 20% loss from May 1st’s intraday high. On a closing basis, the S&P 500 is still clinging to bull market territory with a 19% loss from April 30th’s closing high to today’s close. However, the Economic Research Institute has essentially put an exclamation point on the start of a bear market by declaring the U.S. is tipping into another recession (also see video interview at the end of this post).

Source: FreeStockCharts.com
With the trading range breaking down, many stops have been hit, and sellers take firm control of the market. The burden of proof rests firmly on the buyers who must now struggle with a new resistance level; former support has become resistance. Any fearful trader or investor who did not take the opportunity within the trading range to lighten up, will be all too happy to sell at the next bounce. Bears can short with an “obvious” stop above the former line of support. The only good aspect of this process is that it should kickstart the final washout of sellers.
Given my outlook, it probably seems strange that I would go ahead and buy my first tranche of SSO shares. For me, rules are rules, and I am sticking to the aggressive approach. However, I am also respecting the bear market. My next buy will wait until the volatility index, the VIX, spikes at least 20% from a previous day’s close. From Monday’s close, that would put the VIX at 54 – a level not seen since the March, 2009 lows.
Even as I followed my rule, it was surprising to see hedge fund manager Doug Kass stubbornly stick by his call that the S&P 500 would not break its early August lows (at one point, he even insisted that those lows would not get retested). On Monday, he tweeted throughout the day about adding to his short-term trades in SPY under the assumption that the trading range would hold. His last tweet of the day could not have been clearer: “@davesurfoc @DougKass did you close your longs? No, I view this as opportunity to buy.”
While I PREFERRED that the trading range held, as best I could, I avoided assuming it would hold. I laid out rules defining what I would do upon a break in either direction. On August 19, the S&P 500 skirted bear market territory when I created the following rules for dealing with a bear market:
“…IF and ONLY IF the S&P 500 closes at a new low for the year and THEN follows through with more downside the following day, I will accept that a new bear market has begun. Under these conditions, I will hit the reset button and follow these rules:
- Sell off most short-term trading longs and take the losses.
- Keep short hedges and close them out as the market, presumably, goes lower.
- Add to longs once the market has another climactic sell-off combining T1208 in the single-digits and some kind of spike in the VIX from current levels – note well that this is a rule I am creating as a guideline. It is NOT based on the historical analysis I have discussed in previous posts.
- Add to longs on the first day T2108 exits oversold territory – this rule is consistent with the conservative strategy discussed in previous posts.
- Moreover, I will be more willing to initiate small bearish positions when flagged by other technical indicators…Shorts get more aggressive the higher T2108 goes above oversold territory while the S&P 500 remains in a bear market.”
I think these are still good rules to follow, but I am realizing that I positioned my longs in preparation for an extended rally at some point this Fall. For example, on August 4, I made the case that technical signals warned of an imminent bear market. I forecast the bear market for next year AFTER a strong rally this Fall. Now, I also have these bullish statistics in the back of my head (posted last week):
“…when the third quarter sees an official correction, or a 10 percent or more drop, the ensuing quarter is almost always positive.
The S&P 500 for the July-to-September period lost 12 percent heading into Friday’s trading, which saw the market add to its losses. History, then, suggests that the following quarter will post a gain of 7.2 percent. The trend has held up eight out of nine times.”
Given all this, I am adjusting my approach. I am much more inclined to be as stubborn as Kass and stick to a longer view for the bullish portfolio. This stubbornness combined with my respect for the bear market means that I am going to hold my few remaining bearish positions longer than normal for an oversold period. I will also look to add more out-of-the-money puts as a “just in case” hedge against the market completely falling apart at some point. I of course will look to such an event as an incredible buying opportunity.
Putting it all together…I am holding current longs in anticipation of a strong close for the fourth quarter. Bearish positions will be stickier. Finally, new longs (“T2108 trades”) will be sold quickly, likely once T2108 exits oversold conditions.
I cannot emphasize enough that if you feel scared or are fearful, the T2108 trades are NOT for you. I did not create the conservative strategy for this group; these rules are for opportunistic traders seeking to minimize downside risks.
As always, ping me or leave comments if any of this requires clarification.
Finally, two key charts that confirm the onset of the bear market.
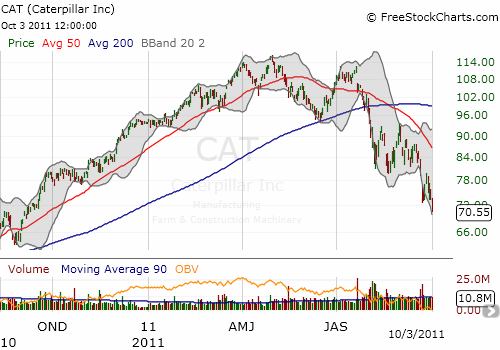
My favorite cyclical stock, Caterpillar, Inc (CAT) has made a clean break to new 52-week lows and continues its recent downtrend. CAT is down almost 40% from its all-time highs.

Source: charts from FreeStockCharts.com
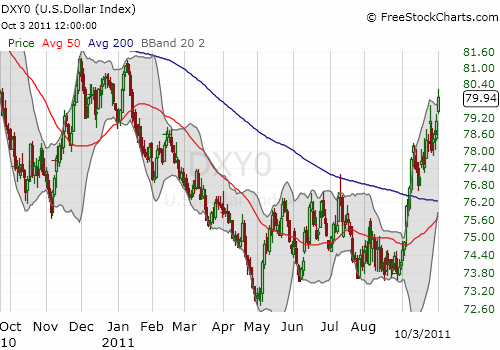
As I expected and explained three weeks ago, the U.S. dollar continues an extended relief rally. The dollar’s sharp ascent over the past month has returned the greenback to positive territory for the year. It should soon challenge the 2011 highs. A break to new highs will have me bracing for a more extended bear market.

Source: FreeStockCharts.com
Bloomberg interview with ECRI co-founder Lakshman Achuthan – detailed explanation of the ECRI’s recession call
Charts below are the latest snapshots of T2108 (and the S&P 500)
Refresh browser if the charts are the same as the last T2108 update.
Black line: T2108 (measured on the right); Green line: S&P 500 (for comparative purposes)
Weekly T2108

*T2108 charts created using freestockcharts.com
Related links:
The T2108 Resource Page
Expanded daily chart of T2108 versus the S&P 500
Expanded weekly chart of T2108
Be careful out there!
Full disclosure: long SSO, net long U.S. dollar

