(T2108 measures the percentage of stocks trading above their respective 40-day moving averages [DMAs]. To learn more about it, see my T2108 Resource Page. You can follow real-time T2108 commentary on twitter using the #T2108 hashtag.)
T2108 Status: 14% (Day #12 of the current oversold period).
VIX Status: 43
General (Short-term) Trading Call: Only add to bullish positions on dips. Hold any remaining bearish positions as small hedges. See below for new modifications.
Commentary
Strange day. The S&P 500 rallied and then faded hard into the close. The net result was a 1.5% loss that left both T2108 AND the VIX right where we left them at Thursday’s close (rounding to nearest unit). VXX actually increased 5% while puts that I bought on the VIX ETF increased in value right along with the underlying. Can you hear my head spinning?
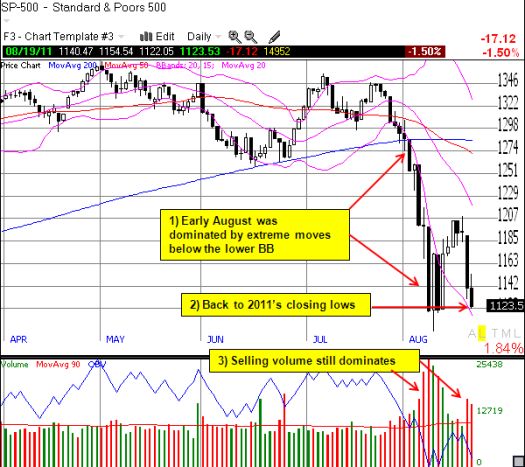
I would love to call this action a bullish divergence, but Friday’s close was so ugly that I must instead focus on bearish implications once again. While I see lots of buying opportunity in this sell-off, I think the mental challenge here is understanding how to prepare for a continuation of an oversold period that is now ranked #8 in duration of 52 total oversold periods since 1987. Moreover, the S&P 500 essentially ended the day at the closing lows of the year, right back to the edge of a bear market as defined by a 20% drop from 52-week highs.
The big difference from last week to this week is that Friday’s close is NOT extreme as measured by the Bollinger Bands. Note well that the first nine trading days of August were so extreme because so much of the action occurred below the lower Bollinger Band. Thanks to the subsequent rally, the current sell-off is well within the 1.5 standard deviations around the 20DMA that I set for the Bollinger Bands (see the pink BBands in the chart).

The S&P 500 is now very vulnerable to a gap down on Monday that shakes out a lot of weaker hands that have placed stops directly below the lows. Typically, that kind of move next generates a sharp snapback rally. We will see. However, IF and ONLY IF the S&P 500 closes at a new low for the year and THEN follows through with more downside the following day, I will accept that a new bear market has begun. Under these conditions, I will hit the reset button and follow these rules:
- Sell off most short-term trading longs and take the losses.
- Keep short hedges and close them out as the market, presumably, goes lower.
- Add to longs once the market has another climactic sell-off combining T1208 in the single-digits and some kind of spike in the VIX from current levels – note well that this is a rule I am creating as a guideline. It is NOT based on the historical analysis I have discussed in previous posts.
- Add to longs on the first day T2108 exits oversold territory – this rule is consistent with the conservative strategy discussed in previous posts.
- Moreover, I will be more willing to initiate small bearish positions when flagged by other technical indicators (for example, the ones I noted on Wednesday when I shorted XLV – since closed out). Shorts get more aggressive the higher T2108 goes above oversold territory while the S&P 500 remains in a bear market.
These rules are designed to attempt to keep potential losses small while staying in the game. At the same time, they fully respect the power and potential of a full-blown bear market, especially an extreme one where one has to start protecting against “Black Swan” events. A few out of the money puts on high-priced speculative stocks, especially in high-tech, could come in real handy (I bought one in Amazon (AMZN) today and just missed buying one in LinkedIn (LNKD)). If we enter a bear market, it will happen well ahead of the “schedule” I mapped out in June! I will also keep actively adding to positions in commodities as part of my “commodities crash playbook.”
As we enter this new fragile juncture in the stock market, I am very interested to hear how you have been managing short-term trades in this environment. Share your thoughts, strategy recommendations, critiques, etc. by leaving comments. You can also email me directly.
Charts below are the latest snapshots of T2108 (and the S&P 500)
Refresh browser if the charts are the same as the last T2108 update.
Daily T2108 vs the S&P 500

Black line: T2108 (measured on the right); Red line: S&P 500 (for comparative purposes)
Weekly T2108

*All charts created using TeleChart:

Related links:
The T2108 Resource Page
Expanded daily chart of T2108 versus the S&P 500
Expanded weekly chart of T2108
Be careful out there!
Full disclosure: long shares and calls on SSO, long VXX puts, long AMZN put

why the hell would you sell now? sell into the snap back rallies..macro I see this as a set up for year end rally…turn off puter til then if you must to avoid making stupid premature trades
My point was to set out a mechanical rule to respect the possibility that the additional downside from here is much deeper than I originally anticipated. That frees cash to buy at even better prices (if we get another VIX spike for example) and increase overall gains. At worst, I am back in around these levels on the way back up.