(T2108 measures the percentage of stocks trading above their respective 40-day moving averages [DMAs]. To learn more about it, see my T2108 Resource Page.)
T2108 Status: 33%.
VIX Status: 23.7
General (Short-term) Trading Call: Hold.
Commentary
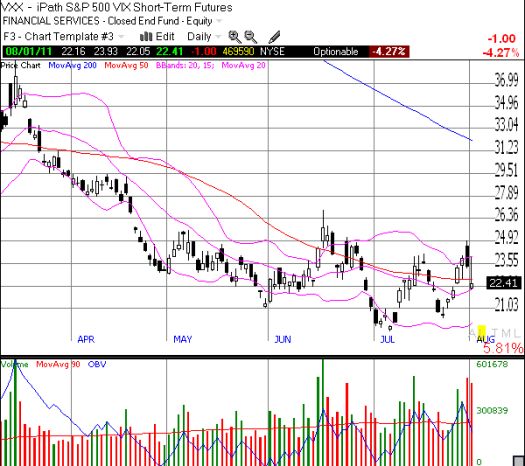
T2108 managed to nudge upward a bit after being at least as low as 29% when the S&P 500 was down as much as 1.4%. It was a wild day that provided one of those reminders of why and how it is important to ignore the headlines in the heat of the moment. By focusing on T2108, I found no reason to chase the market when it soared upward at the open as much as 1.2%: I was looking for a surge of selling to get T2108 closer to oversold levels (20%). When the market violently tumbled, I focused on the volatility index (VIX), and bought a put on VXX as it climbed back to even (trade posted on twitter with the #120trade hashtag.) I plan to add to the VXX put position if it manages to go higher from here.

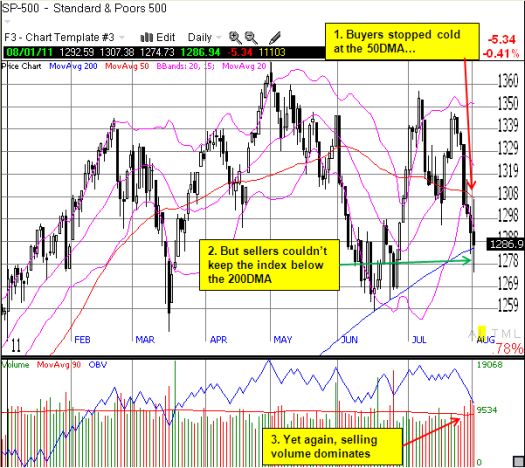
When the S&P 500 punched right through the 200DMA, I thought the market would finally take T2108 close to oversold, but it did not happen. Instead, buyers got to work bringing the index to a close right above the 200DMA..and this just hours after they were stopped cold at the downward-sloping 50DMA. (Have I ever said you just can’t make this stuff up?).

The market now has a slight bullish divergence with T2108 showing such resilience on a down day for the S&P 500. However, without T2108 getting closer to 20%, I hesitate to suggest it is time to get aggressive with bullish positions. I am also not recommending closing out any more bearish positions. The chart of the S&P 500 shows lower highs from the May to the two July peaks. Bears can sit tight with remaining positions until July highs are broken even though time has just about run out for sellers to retest the June or 2011 lows for this trading cycle.
Charts below are the latest snapshots of T2108 (and the S&P 500)
Refresh browser if the charts are the same as the last T2108 update.
Daily T2108 vs the S&P 500

Black line: T2108 (measured on the right); Red line: S&P 500 (for comparative purposes)
Weekly T2108

*All charts created using TeleChart:

Related links:
The T2108 Resource Page
Expanded daily chart of T2108 versus the S&P 500
Expanded weekly chart of T2108
Be careful out there!
Full disclosure: long puts on SSO and VXX puts
