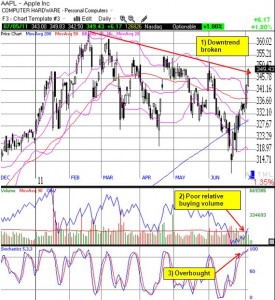
Apple (AAPL) initially failed a critical technical test at the 200-day moving average (DMA) and even made a new low for 2011, but the stock’s under-performance has finally ended. AAPL has gained over 10% since its 2011 low June 20th. The majority of the gains have come on just 4 days with strong bursts of 3.2%, 2.7%, 2.3%, and 1.8% to close today (July 5) above the 2011 downtrend line. If there is anything that prevents me from getting overly bearish despite overbought conditions in the stock market, it is AAPL shooting skyward. Hard to be a bear when AAPL is being a bull.
Click graphic to enlarge

*Chart created using TeleChart
Be careful out there!
Full disclosure: no positions

Thanks very much! Like all your stuff, good read.