(T2108 measures the percentage of stocks trading above their respective 40-day moving averages [DMAs]. To learn more about it, see my T2108 Resource Page.)
T2108 Status: 30% and Neutral (oversold territory relative to behavior over past two years).
General Trading Call: Continue covering shorts. Identify longs for buying IF T2108 gets to official oversold territory at 20% or below.
Commentary
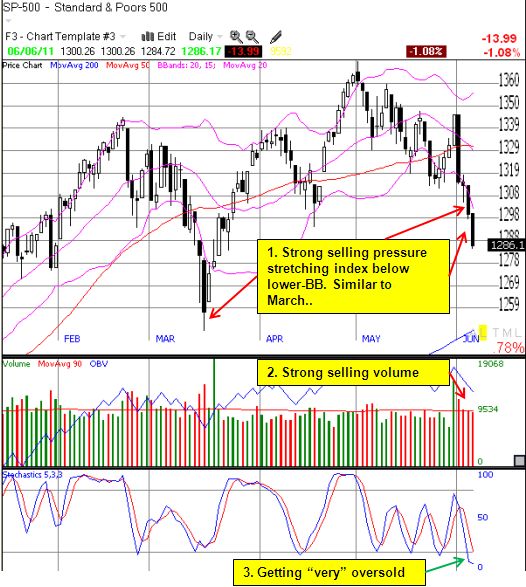
As expected, T2108 dropped to the lower end of my 30-40% downside target range. The S&P 500 continued its slide with another 1% drop. The technicals on this selling support an oversold reading for the index. The chart below shows the stochastics on the S&P 500 are even more oversold than the March lows (they last reached these levels in the brief swoon in November, 2010). The selling volume has been steadily heavy and has stretched the index further and further below the lower Bollinger Band (BB). The index has now become a rubber band just waiting to snap back.

However, this is where things get “hard.” The official oversold territory on T2108 is 20% or below. As I have mentioned several times, this indicator has rarely reached such depths since the March, 2009 lows. Instead, 30% has provided a frequent bottom. So, it makes sense to keep covering shorts here, but going long may only provide a trade good for a day or two. If we get a repeat of the March bottom, the best buying point has already passed with Monday’s close.
The nearly consistent buying right after these deep swoons in the market must be tiring out the bulls (do not forget Macke’s purple crayon!). At some point, sheer buying exhaustion should lead to an even greater flush taking T2108 to its true oversold position. We just cannot know when that moment has finally arrived (assuming it will).
Friday’s poor employment numbers provide plenty of reason for bearishness, but the market, in its ever-contrarian and ebullient ways, has tended to treat poor employment numbers as lagging indicators…well, just because that is the historical pattern. Given the rally to multi-year lows, the market has essentially completely ignored any negative signals in these numbers. What happens when the market finally accepts that employment issues are not only deeply entrenched but also will impact real economic activity sooner than later? Selling momentum “should” get even stronger, but never forget that such an alarm will also get the Federal Reserve back into the stimulation game, at least to the extent the current political environment will permit it to act.
Speaking of which, the end of quantitative easing part 2 (QE2) has produced a raging debate on whether the market is going to plummet from lack of its main (or only) prop or whether this moment will mark the biggest contrarian moment yet. I do not know how anyone can anticipate the subsequent reaction. Much better to stick even closer to the technical indicators and keep an eye on how the market responds to the news and not the news itself. So far, I see every reason to remain cautious, even bearish, over the course of the summer and perhaps into the autumn, relief rallies and the stories of individual stocks or sectors notwithstanding (I will try my best to distinguish carefully amongst these categories).
(Additional reading: “Summer’s Positive Gains Can Come With High Risks.”)
Charts below are the latest snapshots of T2108 (and the S&P 500)
Refresh browser if the charts are the same as the last T2108 update.
Daily T2108 vs the S&P 500

Black line: T2108 (measured on the right); Red line: S&P 500 (for comparative purposes)
Weekly T2108

*All charts created using TeleChart:

Related links:
The T2108 Resource Page
Expanded daily chart of T2108 versus the S&P 500
Expanded weekly chart of T2108
Be careful out there!
Full disclosure: long SSO puts
