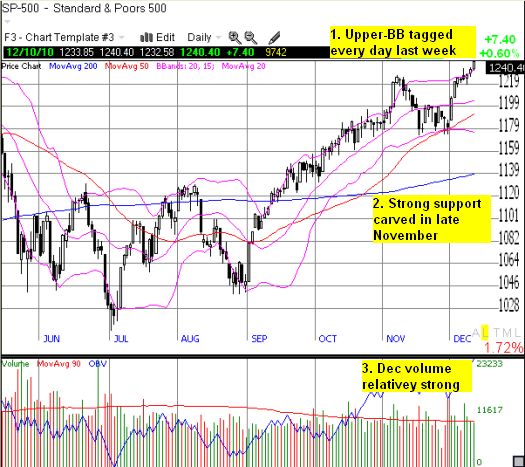
The S&P 500 printed fresh 2-year highs last week with decent volume. This marks a successful follow-through to the breakout from November’s trading channel. Given the index is now tagging the upper-Bollinger Band, it is even more likely that this move will be sustained, at least in the short-term.

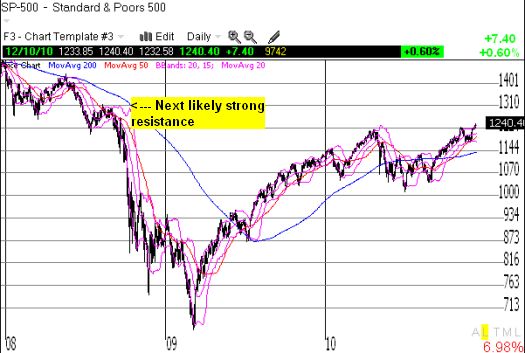
The longer-term chart suggests that the next strongest resistance sits from 1300-1310 or so:

*All charts created using TeleChart (except where otherwise noted):

The market is also not yet overbought with T2108 hovering above 60% for most of the month. This setup supports further upside to come in the short-term.
Be careful out there!
Full disclosure: long SSO puts and calls
