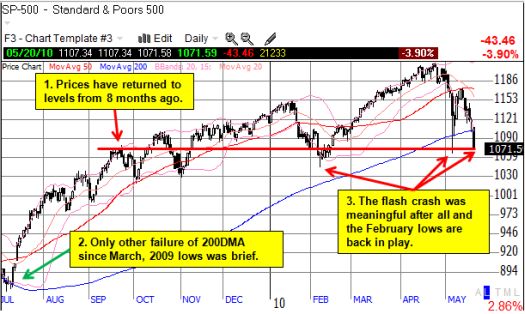
For 14 months the S&P 500 has trended upward from the March lows. However, with the S&P 500 now down 3.9% for the year, the last 8 of these 14 months have produced no net gain in the index. Another 3% drop will produce the first lower low on the index since July, 2009. The 200-day moving average (DMA) last failed during that time as well.

*Chart created using TeleChart:

T2108 (the percentage of stocks trading above their respective 40-day moving averages) dropped to an extreme 9.7%, generating the lower low I have expected. T2107, the percentage of stocks trading above their respective 200DMAs, has also made a lower low as it has plunged to 46.0%. The stock market was last at these levels exactly a year ago.
These milestones are yet more evidence that a technical breakdown of the stock market is underway. Trader Mike provides a good overview of the weak technical conditions across all the major indices in “T2108 at 14 Month Lows as Market Revisits Flash Crash Levels.” Note well that several days before this retest of the “flash crash” lows in stocks, the currency “safe havens” in the U.S. dollar and the Japanese yen punched right through their respective flash crash highs against almost all other major currencies.
The good news is that the stock market rarely spends much time at these deeply oversold levels. The stock market is two days into the current oversold period and the vast majority of these last fewer than seven days. T2108 “broke down” in 2008 and 2009 when the market faced extreme and sustained selling pressure, and T2108 remained very low for extended periods of time. If those kinds of oversold conditions return, the market will deliver its clearest sign yet it has topped out for the time-being.
However, with the VIX soaring almost 10% higher than the highs from the last oversold period (the day AFTER the flash crash), the technical (short-term) buy signal has grown even stronger (click here for a review of my last analysis of the relationship between the VIX and T2108. A comprehensive update is coming by July).
I started scaling into trading longs on the first oversold day with QQQQ calls. That trade failed miserably, and I used the extra selling pressure to close out almost all my May-dated puts and a few June-dated puts on individual stocks. At the same time, I started scaling into calls on SSO (and nibbled on IVV). With the market closing on the lows, I am expecting extreme downward pressure on Friday’s open. Such a move will provide an ideal opportunity to accelerate accumulation of long positions and perhaps sell most of my remaining June puts on individual stocks. If instead we gap up or have a strong rally for most of the session, I will most likely do nothing.
The biggest overall problem with going long is that overhead resistance will be stronger than ever in this weakening technical environment (Trader Mike makes this point as well). Accordingly, my upside expectations will remain modest for oversold bounces, and I will look to fade rallies as they head into resistance.
Be careful out there!
Full disclosure: long SSO calls, long QQQQ calls, long IVV

Good post, thanks. (Picked it up from stocktwits)
Thanks for the kudos, Michelle! And thanks for reviewing my post.