Last week, I claimed that the deeply oversold conditions presented a short-term buying opportunity, but that the downward trend in the percentage of stocks trading above their respective 40-day moving averages (DMAs) and 200DMAs (T2108 and T2107) pointed to a steadily weakening market in the near future. I expected sellers to step up at the 50DMA support-turned-resistance. This failure occurred on Thursday with very strong follow-through on Friday. This event marks the first convincing failure of the 50DMA of the entire rally off the March, 2009 lows. Steadily rising prices in the stock market have helped mask other technicals that steadily worsen and help us quickly forget about past technical damage. However, the accumulating evidence continues to point to a declining reward/risk ratio for going long and an increasing reward/risk ratio for going short in this market.
The good news is that the “flash crash” did not generate a lower low for the S&P 500. The only lower low occurred in July. At that time, it seemed the bounce from the March, 2009 lows was already coming to an end. Numerous tests and retests of the 50DMA, and 14 months later the S&P 500 has retained its uptrend. The 50DMA has strongly supported the entire length of the stock market rally. This uptrend must be respected and presumed to hold until a lower low finally occurs again (and then a lower high).
Interestingly, EACH failure of the support at the 50DMA occurred in conjunction with earnings season, almost like clockwork. This timing has sometimes fooled analysts (myself included!) into thinking that the market had finally printed a lasting top. Until this year, the market turned on a dime at these junctures and zipped back to fresh highs, typically on low buying volume. The next three charts review the dynamics of each test of support (click on charts for full-size). While the S&P 500 is marginally higher for the year, the two strong breaks of support in 2010 could be two more bright red warning flags, especially given the weak-volume rallies that preceded each breakdown.
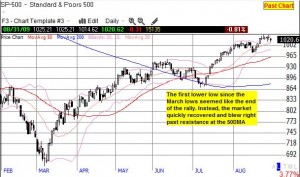
In July, 2009, I anticipated a bounce from oversold conditions at the time, but I also assumed that a head and shoulders pattern within a multi-month trading range would continue to constrain the stock market. The head & shoulders pattern fooled most bears, and the sharp rise from that point was likely fueled in large part by a massive short squeeze.
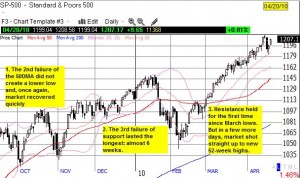
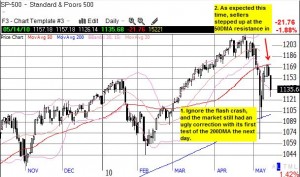
Taken together, the trend points to a transition of the 50DMA from support to resistance. A break of the 200DMA and lower lows will add more evidence of a weakening stock market.
In the meantime, the currency markets are flashing even brighter red warning signs. The U.S. dollar is spiking higher and higher to levels last seen during the financial panic of 2008 and 2009. This move once again demonstrates the power of the 200DMA as an indicator for the dollar index. When the dollar finally broke out above the 200DMA in January I stated “…the dollar has broken out: the short-term downtrend has ended, and the current move has considerable upside potential.” The dollar has gained over 10% since then.
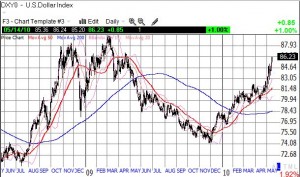
This rise in the dollar will crimp the profits of most American mutli-nationals. These prospects will likely not matter to bulls in the stock market until companies start issuing warnings and then analysts start reducing earnings estimates. As austerity measures spread across Europe, long-term prospects for financial health should improve. However, in the short-term, already anemic growth could turn negative again, hurting all companies and countries that depend on European consumption. Note well that the eurozone is China’s largest trading partner – the Shanghai index has gone nowhere for a year and yet the China story seems to carry as much cachet as ever. (The index has plunged 14% since early April).
The on-going collapse of the euro is a major driver of the strength in the U.S. dollar index (the British pound is also dropping like a stone, further confirming my long-standing bearish stance against the currency). The European Central Bank (ECB) attempted to shock and awe financial markets with a trillion dollar support program for sovereign debt, but the only shock is the awesome insistence of the market for taking the euro even lower – even as some European finance officials call the markets “insane”, “mad”, and even “stupid” (hey, next time, do not borrow money from the bond vigilantes!). It only took a little over a day for the U.S. dollar to reverse its losses after the trillion-dollar announcement. On Friday, the euro hit new multi-year lows against the U.S. dollar, and the Japanese yen finally reversed its losses against the euro on Friday.
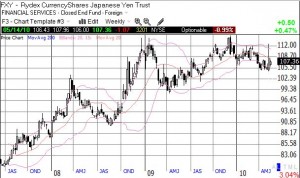
Once the yen finally picks up steam against the U.S. dollar, we will know that the flight from risk is reaching full swing. The yen experienced a temporary spike against the dollar during the flash crash. The weekly chart for the Japanese yen ETF shows a steady uptrend since at least the beginning of the last bear market. This trend stalled in 2010, but I now expect it to resume soon. The strength of the yen against the dollar in 2009 was explained by the general weakness of the dollar. The next round of yen strength will accompany shrinking risk appetites.
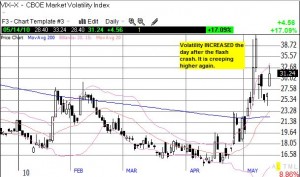
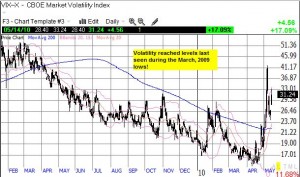
Finally, the surge in the volatility index has been true shock and awe. In a matter of days, the index went from multi-year lows to levels last seen since the March, 2009 lows. Again, it is too easy to dismiss this pop as an aberration from the flash crash, but volatility increased the following day without the S&P 500 printing new intra-day lows. Volatility should remain elevated and drive even more nauseated investors (and traders) out of the stock market. Such a migration will further weaken the already tepid buying power in the market.
*All charts created using TeleChart: 
Add in the latest surge in gold and silver, all this technical evidence seems to make an upcoming sustained sell-off in the market a foregone conclusion (including the last post on this issue). However, I will repeat that the stock market remains in an uptrend; it is innocent until proven guilty. The higher prices are masking these steadily worsening technicals for now. Bulls continue to cling to lots of reasons and themes for justifying buying and holding in this market (see “Stocks Poised for Big Rally” for one of many examples), including the traditional, casual dismissal of any bear case as more reasons to keep climbing the wall of worry (that tends to work as long as the market is actually going up). Moreover, we have also seen how little volume is necessary to keep the market afloat and lifting from oversold levels. Until the market retests the 200DMA and then, eventually, the February lows, shorts should continue to be held for short durations. Similarly, oversold conditions will continue to generate (short-term) buying opportunities. Ultimately, I am arguing for being prepared – the next big sell-off will be sooner than most expect, yet it will NOT be a surprise.
Be careful out there!
Full disclosure: long SLV, short EUR/USD, long EUR/JPY, short GBP/USD, short GBP/JPY

1 thought on “Steadily Rising Stock Market Prices Masking Steadily Worsening Technicals”