

Housing Market Intro and Summary
What happened in the housing market for August, 2025? The housing data remained stuck in slowdown territory, but the stock market followed through as expected on a bearish to bullish turn in the prices of the stocks of home builders. Financial markets are largely anticipating lower mortgage rates as a result of easing monetary policy from the Federal Reserve. Lower mortgage rates should in turn translate into greater housing demand given the strength of the economy. At the margins, more home owners will supply inventory into the market given an increased willingness to trade in their currently lower mortgage rates. This sequence is far from guaranteed to play out, but the narrative is convincing enough to fuel the hopes and projections that can feed a bearish to bullish turnaround.
Here is a summary for August’s market data:
- The stocks of home builders exited bearish territory as symbolized by the the iShares US Home Construction ETF (ITB) closing above its bear market line. That line (conventionally) represents a 20% loss from the all-time high.
- Home builder sentiment resumed its decline toward its pandemic low.
- Single-family housing starts have stagnated/stabilized well below the 1M level.
- Sales of new single-family homes continue to levitate above the 600M level in the middle of a near 3-year sales range.
- Existing home sales increased off an 8-month low with the media price easing off its all-time high.
- Sales in California’s existing home market softened in July as expected.
- Housing unaffordability reached record high by one measure as various measures continue to try to address the related housing challenges.
- Mortgage rates fell most of the month to an 8-month low.
Housing Stocks
In August, the iShares US Home Construction ETF (ITB) completed the bearish to bullish reversal that I anticipated several months ago. Perhaps in telling fashion, ITB jumped 2.7% to start August while the S&P 500 sank 1.6% that same day. After spending 5 straight trading days right at the bear market line (see below) (imagine that), ITB resumed its rally and soared to a 13.4% gain for the month versus the S&P 500’s 1.9% gain.
Homebuilders formed a core of my best trades for the month. I finished taking profits in all but one builder: Taylor Morrison Home Corporation (TMHC). I sold September $70 calls against my TMHC holdings. If these shares get called away from me, I will be ok with the resulting profits, but I am hoping that the calls expire worthless. I continue to hold my core ITB position. With only about two months to go for the start of the seasonally strong period for the stocks of homebuilders, I will likely hold ITB for quite some time more. Perhaps the season got an early start in August…?
")
Housing Data
Home Builder Confidence: The Housing Market Index – August, 2025
The National Association of Home Builders (NAHB)/Wells Fargo Housing Market Index (HMI) resumed its decline. June’s 2-point decline took the HMI to its 3rd lowest level since 2012. July’s 1 point increase gave a brief and shallow relief to the declines as the HMI for August fell back to 32. The pandemic-driven low of 30 still seems within reach by year-end. The NAHB attributed the decline to a familiar laundry list of issues: “elevated mortgage rates, weak buyer traffic and ongoing supply-side challenges”.
While the aggregate HMI fell, only one component fell. Consistent with the seasonal lull following the active spring selling season, the “Single-Family: Present” component fell by one point. The “Traffic of Prospective Buyers” component increased 2 points off a two year low and probably just marks a kind of “relief” bounce. The “SF Detached Next Six Months” component stayed flat. With a 16th straight month of HMI measuring below 50% (negative territory) all these components remain near pandemic lows. As part of the bearish to bullish reversal, I am still assuming sentiment will not break the pandemic low.
/Wells Fargo Housing Market Index (HMI) and the University of Michigan Index of Consumer Sentiment")
Source for data: NAHB and the University of Michigan
Improving consumer sentiment had diverged significantly from HMI for the last few months. August’s drop looks like the beginning of a resumption in a downtrend in consumer sentiment.
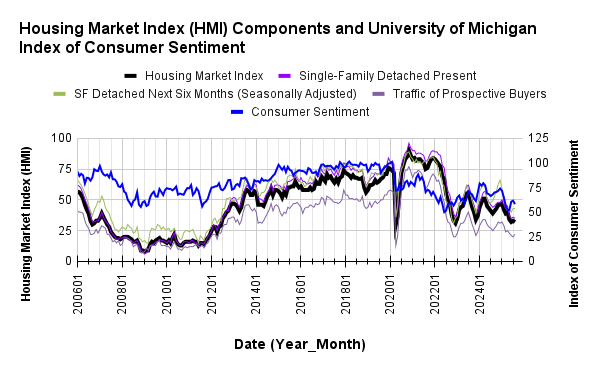
Overall pricing power declined again for builders. The share of builders providing incentives surged from 62% in July to 68% in August, the highest level since the start of the pandemic. The average price discount remained flat at 5% where it has stayed since November, 2024. The 37% share of builders cutting prices is one percentage point down from the record setting level of 38% set in July.
The Northeast managed to drive the entire decline in the HMI. So given the volatility in that region, I am much more confident that the HMI remains in a bottoming process. After increasing three months in a row, the Northeast’s HMI suddenly plunged from 48 to 39. The Midwest and the South stayed flat at 43 and 29 respectively. The West was the only region with a gain going from 25 to 26. The West and the South are still near rock bottom levels.
New Residential Construction (Single-Family Housing Starts) – July, 2025
Single-family housing starts barely budged in July but continued a 5-month streak lingering under the 1M level. July starts increased 2.8% from June and jumped 7.8% year-over-year (following a 6.9% year-over-year plunge in June – including an upward revision).
![US. Bureau of the Census, Privately Owned Housing Starts: 1-Unit Structures [HOUST1F], first retrieved from FRED, Federal Reserve Bank of St. Louis, August 19, 2025](https://drduru.com/onetwentytwo/wp-content/uploads/2025/08/20250819_Housing-starts-July-2025.png "Housing starts")
In a potential sign confirming bottoming builder sentiment, building permits increased sequentially for the first time since February. Permits increased 0.5% from June but still declined 7.9% year-over-year. Permits have declined year-over-year since June, 2024.
The South was a standout exception to the regional year-over-year declines in starts. The Northeast, Midwest, South, and West each changed -5.2%, -2.3%, +21.8%, -13.7% respectively year-over-year. However, the South changed -18.5% year-over-year in June (unrevised).
New Residential Sales (Single-Family) – August, 2025
New home sales barely budged sequentially but declined significantly year-over-year thanks to sales tumbling in three of four regions (same as the unrevised numbers from June). Sales declined 0.6% from an upwardly revised June sales figure of 656K to 652K in July. Year-over-year sales declined 8.2%. As a reminder, the current range needs to hold firm to support the bearish to bullish reversal for the stocks of home builders.
![US. Bureau of the Census, New One Family Houses Sold: United States [HSN1F], first retrieved from FRED, Federal Reserve Bank of St. Louis, August 28, 2025](https://drduru.com/onetwentytwo/wp-content/uploads/2025/08/20250828_New-home-sales-July-2025.png "new home sales")
For July, the median price for new homes dropped 0.8% sequentially and dropped 5.9% year-over-year to $403,800 (June’s median price was revised upward). I am holding on to my assumption that a price range between $400,000 and $440,000 will hold given mortgage rates continue to decline. The prospect of Fed rate cuts has the potential to lower the long-end of the yield curve, but the bond market may not cooperate if it interprets a rate cut as inflationary. As long as sales hold up with lower prices, the bearish to bullish reversal should remain intact. However, prices could increase significantly if lower mortgage rates significantly drive up demand.
As with many of the prior swings, July’s price swung with notable changes in sales mix. The big shifts in distribution happened this time at the bookends. On a year-over-year and sequential basis new single-family homes shifted sharply into the $500,000 range with even the sub $300,000 range gaining. The $1M and over range dropped sharply from 6% to 3% sequentially. The share of sales was 4% a year ago. This shift ends a period of relative stability for the $1M and over segment.
June’s inventory was revised downward from 9.8 months of sales to 9.2. July logged the same inventory level. For comparison, a year ago inventory sat at 7.9 months of sales. Absolute inventory actually declined sequentially for the second month in a row. What looked like a steady increase now looks like a plateau since February. Thus absolute inventory may end up falling short of challenging the all-time peak from the housing bubble in 2006. New and existing housing inventory is at 5.2 months of sales, the highest point since 2015. (Recall that the market is balanced at roughly 6 months).
The Midwest was the only region to lose sales year-over-year in June and flipped to the only region to gain year-over-year sales in July. The Northeast, Midwest, South, and the West changed -23.5%, +4.9%, -4.0%, -19.9% respectively year-over-year. On a month-over-month basis, the West experienced major relief with an 11.7% gain.
Existing Home Sales – July, 2025
Existing home sales continued a bounce along recent lows with July’s data. July’s existing home sales increased 2.0% month-over-month and 0.8% year-over-year. The National Association of Realtors (NAR) attributed the rebound to an “ever-so-slight improvement in housing affordability” given wage growth increased more than home prices in the month. The claim is odd: I cannot imagine someone hopping up to buy a house right after experiencing a wage increase. Homes are still incredibly expensive and unaffordable with the median existing home price at all-time highs.

(For historical data from 1999 to 2014, click here. For historical data from 2014 to 2018, click here) Source for chart: National Association of Realtors, Existing Home Sales© [EXHOSLUSM495S], retrieved from FRED, Federal Reserve Bank of St. Louis, August 21, 2025

Absolute inventory resumed its upward climb with a 0.6% sequential gain to 1.55M unsold homes, also a 15.7% year-over-year gain. According to the NAR, there is a “4.6-month supply of unsold inventory, down from 4.7 months in June and up from 4 months in July 2024”. The decline in months of supply ends an uptrend streak at six months. Absolute inventory increased for a 6th straight month.
The median sales price of an existing home fell 2.4% from the $432,700 record set in June to $422,400 in July. The median price barely held a 25-month streak of year-over-year gains with a 0.2% year-over-year increase.
The NAR flipped from the prior report, where it applauded the relentless price increases as a win for wealth creation, to this report celebrating that “near-zero growth in home prices suggests that roughly half the country is experiencing price reductions.” Still, the NAR went on to note the “cumulative 49% home price appreciation for a typical American homeowner” over 6 years as a sign of market health even as “homebuyers are in the best position in more than five years to find the right home and negotiate for a better price” because of a 6-year high in inventory. These characterizations sound surreal in combination, like finding a win-win for buyers and sellers despite the jagged contours of the market.
The average time on the market for an existing home increased from 27 in June to 28 in July. The year-over-year increase from 24 days highlights the sluggishness of the market.
The share of sales going to first-time home buyers dropped from 30% in May and June to 28% in July, also down from 29% a year ago. The NAR’s 2017 Profile of Home Buyers and Sellers reported an average of 34% for 2017, 33% for 2018, 33% for 2019, 31% for 2020, 34% for 2021, 26% for 2022, 32% for 2023, and a plunge to an all-time low of 24% in 2024.
The West was the only region that declined in sales year-over-year. The regional year-over-year changes were: Northeast +2.0%, Midwest +1.1%, South +2.2%, West -4.0%.
Single-family existing home sales increased 2.0% to 3.64M in July and increased by 1.1% year-over-year. The median price of a single-family home was $428,500, up 0.3% year-over-year and down 2.3% month-over-month.
California Existing Single-Family Home Sales – July, 2025

A bit of gravity returned to California’s market for existing single-family homes. July sales decreased 1.0% from June to 261,820 and decreased 4.1% year-over-year. The median price fell 1.7% month-over-month and 0.3% year-over-year to $886,420. The median price per square foot fell year-over-year for the third straight month, this time falling from $437 to $435. After finally falling in June after an extended stretch at 100%, the sales-price-to-list-price ratio fell again in July, this time from 99.3% to 98.5%. In other words, the California market broadly softened and slowed in July. Lower prices did not keep sales aloft and instead underlined market weakness.
The California Association of Realtors (C.A.R) called June’s market “stagnant”. The organization called July’s market a “modest slowdown”. Pending sales fell year-over-year for the seventh straight month, pushing C.A.R. to predict a “soft” July. C.A.R.’s president remained hopeful for a rebound in the second half of the year. Still, lower mortgage rates and a resulting increase in purchase applications hold out the prospect of “stronger buyer activity and renewed demand in the months ahead”.
In the meantime, June’s unsold inventory index (UII), which measures the number of months needed to sell the supply of homes on the market at the current sales rate, fell slightly from 3.8 in May and June to 3.7 in July. The UII was 2.9 a year ago. Total active listings increased 37.7% year-over-year (in May it was 50%, in June it was 40%) for a 69-month high and an 18th straight year-over-year increase. C.A.R.’s prior prediction for a slowdown in the growth rate in new active listings leading to “a plateau sometime in the next two months” came to fruition.
The median time on market increased from 24 days in June to 28 in July, up from 20 a year ago.
Home closing thoughts
Accidental Landlords Clogging Up Housing Supply
One of the common and familiar narratives about the housing market involves homeowners refusing to sell homes purchased at much lower interest rates than the rates available today. BiggerPockets claims that some of these homeowners are also waiting for better prices (as if prices are not already high enough) and choosing to rent out these homes. In some major housing markets, rental inventory has increased by as much as 20% due to this dynamic. Rent growth has also slowed as a result.
Record Unaffordability In Housing
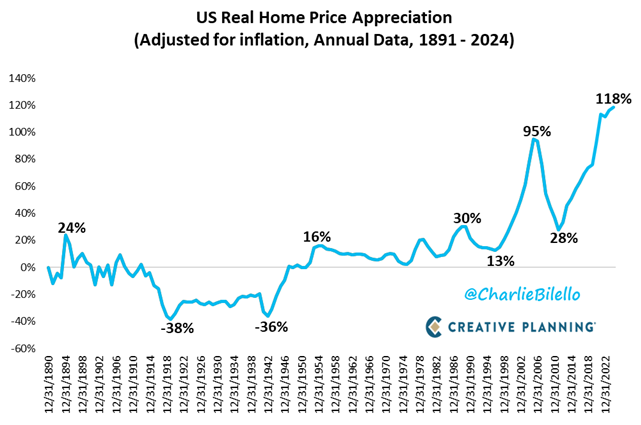
While some homeowners wait for higher prices, many more buyers are likely waiting for much lower prices. Seeking Alpha summarized research from Creative Planning’s Charlie Bilello on the record level of unaffordability in U.S. housing: “The median American household would now need to spend a record 47% of their income to afford the median-priced home for sale, making the current market even less affordable than during the 2000s housing bubble”.
States Pressuring Cities on Affordable Housing
Restless states continue to try different approaches to convince and even force uncooperative cities into increasing housing supply. NPR went to Utah to report on state efforts to motivate cities to provide affordable housing:
“Utah started requiring cities and counties to provide affordable housing options in the 1990s, focused on people who make 80% or less of the local median income. But that rule was easily ignored. So in recent years, the state has amped up both the carrot and the stick, passing laws to encourage development and to enforce its mandate. Towns and counties now have to pick a handful of ways to create denser, cheaper housing and report on their progress every year.”
A complaint from a city official highlights the tensions involved when states try to compel action: “State mandates coming top down are really just flouting the will of the people…Where there’s so much housing going on and density going up that has been forced on us by the state, and the infrastructure isn’t there, you’ve seen that quality of life diminish”.
Astronomical Prices for Affordable Housing (Fremont, CA)
Even when cities move to provide affordable housing, the effort can incur high costs. Fremont, CA recently celebrated the opening of Bell Street Gardens for residents in the affordable housing market. According to numbers reported by The Tri City Voice, each unit cost an astounding $794K. Most of the units also only offer single bedrooms, 90 of the 126 (71%).
“The City of Fremont gave a total of $13 million toward the project, 10 million from the city’s affordable housing fund (which comes out of fees from market rate housing). According to a 2022 document from the County of Alameda, the entire project came out to over 100 million.”
This kind of “affordable housing” is not scalable and cannot solve the housing or affordability crisis.
Spotlight on Mortgage Rates
The Mortgage Bankers Association (MBA) reported 1 week with an increase in mortgage applications and two weekly decreases for the month of August. New home purchase mortgage applications for July increased 6.8% year-over-year and increased 7.0% from June (not seasonally adjusted).
Mortgage rates resumed a slight downtrend that suggests 7% should hold as a top for now. Rates fell from 6.72% at the end of July to 6.56% at the end of August. I remain cautious about the impact of a more dovish Federal Reserve on long-term rates. Again, recall that last year’s Fed rate cuts into a strong economy moved bond markets to send long-term yields higher. The economy may even be strengthening into rate cuts with the Atlanta Federal Reserve GDPNow forecast for Q3 soaring from 2.3% at the end of July to a 3.5% forecast at the end of August.
![Freddie Mac, 30-Year Fixed Rate Mortgage Average in the United States [MORTGAGE30US], retrieved from FRED, Federal Reserve Bank of St. Louis; August 30, 2025](https://drduru.com/onetwentytwo/wp-content/uploads/2025/08/20250830_30-Year-Fixed-Rate-Mortgage-Average-in-the-United-States.png)
Be careful out there!
Full disclosure: long ITB, long TMHC shares and short calls