Stock Market Commentary:
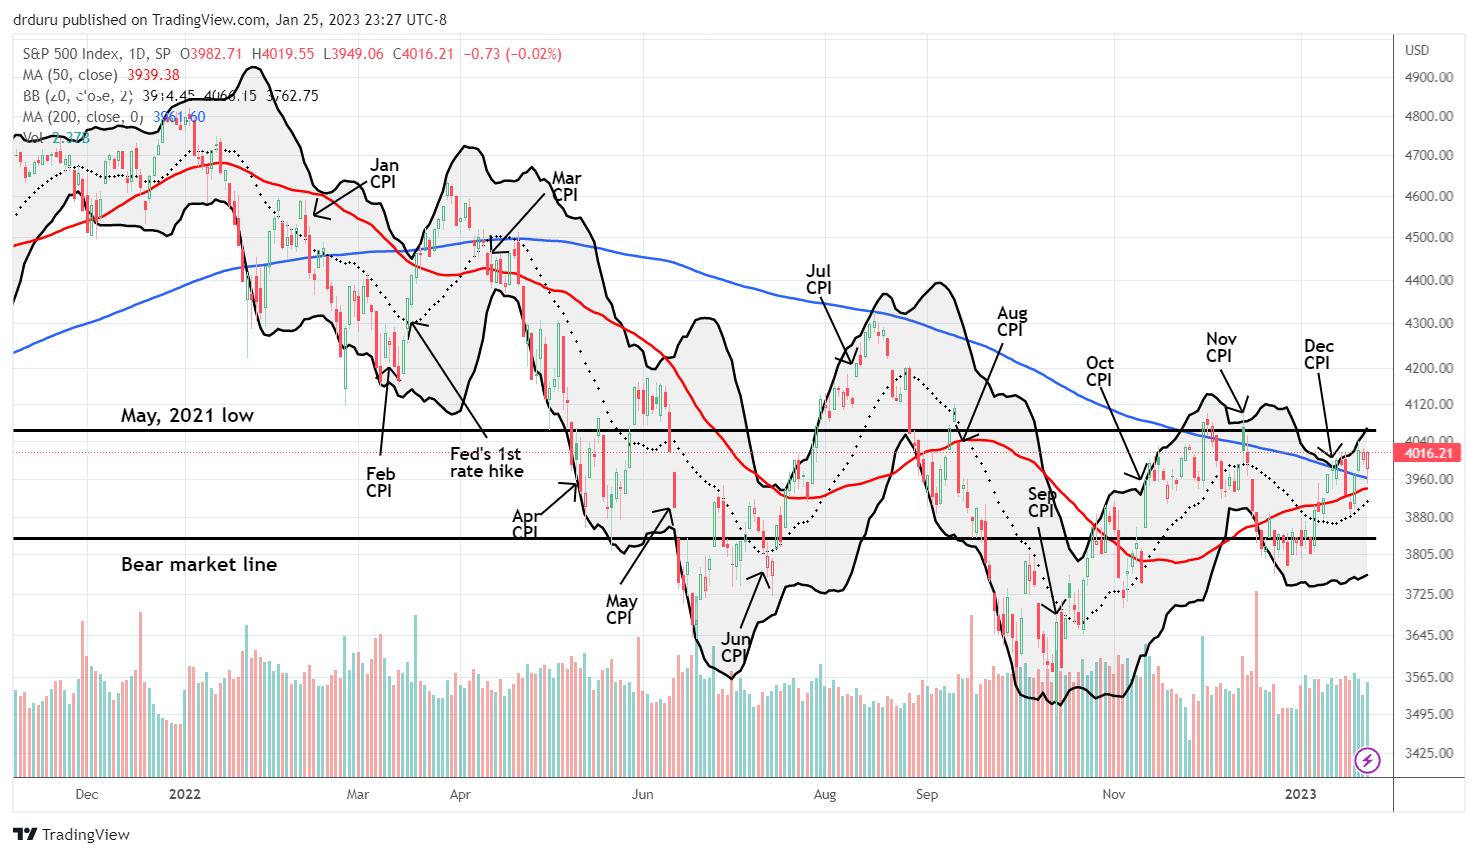
The S&P 500 defended support at its 200-day moving average (DMA) for the first time in 10 months. The index was down 1.7% at its lows where it pierced its 200DMA and looked ready to challenge its 50DMA. Buyers stepped in at that point and proceeded to reverse the entire loss on the day. This bullish trading action highlighted a complete post-earnings recovery for Microsoft (MSFT) from a 4.6% loss at its lows to a tiny gain before closing down 0.6%. Apple chimed in with a defense of its 50DMA at the lows of the day. Even the currency markets agreed with the bulls with the Australian dollar versus the Japanese yen (AUD/JPY) confirming a 50DMA breakout for the first time since the summer. It was a surreal day with the world inching ever closer to an official world war with the U.S. and Germany rolling out tanks for Ukraine.
The Stock Market Indices
The last three 200DMA breakouts for the S&P 500 (SPY) were busts. The last time the S&P 500 defended 200DMA support was, ironically enough, in the wake of the Federal Reserve’s first rate hike 10 months ago way back in March. Today, the S&P 500 had to reverse an initial 1.7% loss to defend 200DMA support. The index is now a higher close away from confirming that support…also for the first time in 10 months.
The NASDAQ (COMPQ) seems to have a date with destiny at its declining 200DMA resistance. Buyers stepped in after the tech-laden index gapped lower at the open by 2.3%. The NASDAQ ended the day essentially flat and kept a test of 200DMA resistance in play.
The iShares Russell 2000 ETF (IWM) is ahead of the S&P 500 and the NASDAQ on the technicals. The ETF of small caps successfully defended 200DMA support last week. Now, the uptrending 50DMA and 20DMA have converged with the 200DMA to buttress support. IWM’s reversal on the day keeps a test of the bear market line in play. I sold my IWM call spread on Monday’s sprint higher into resistance from last week’s peak.
Stock Market Volatility
The volatility index (VIX) is inching its way lower. While the VIX closed below 20 again, it is not at new lows for the year. So while the major indices are incrementally more bullish, the VIX is not yet.
The Short-Term Trading Call A First In 10 Months
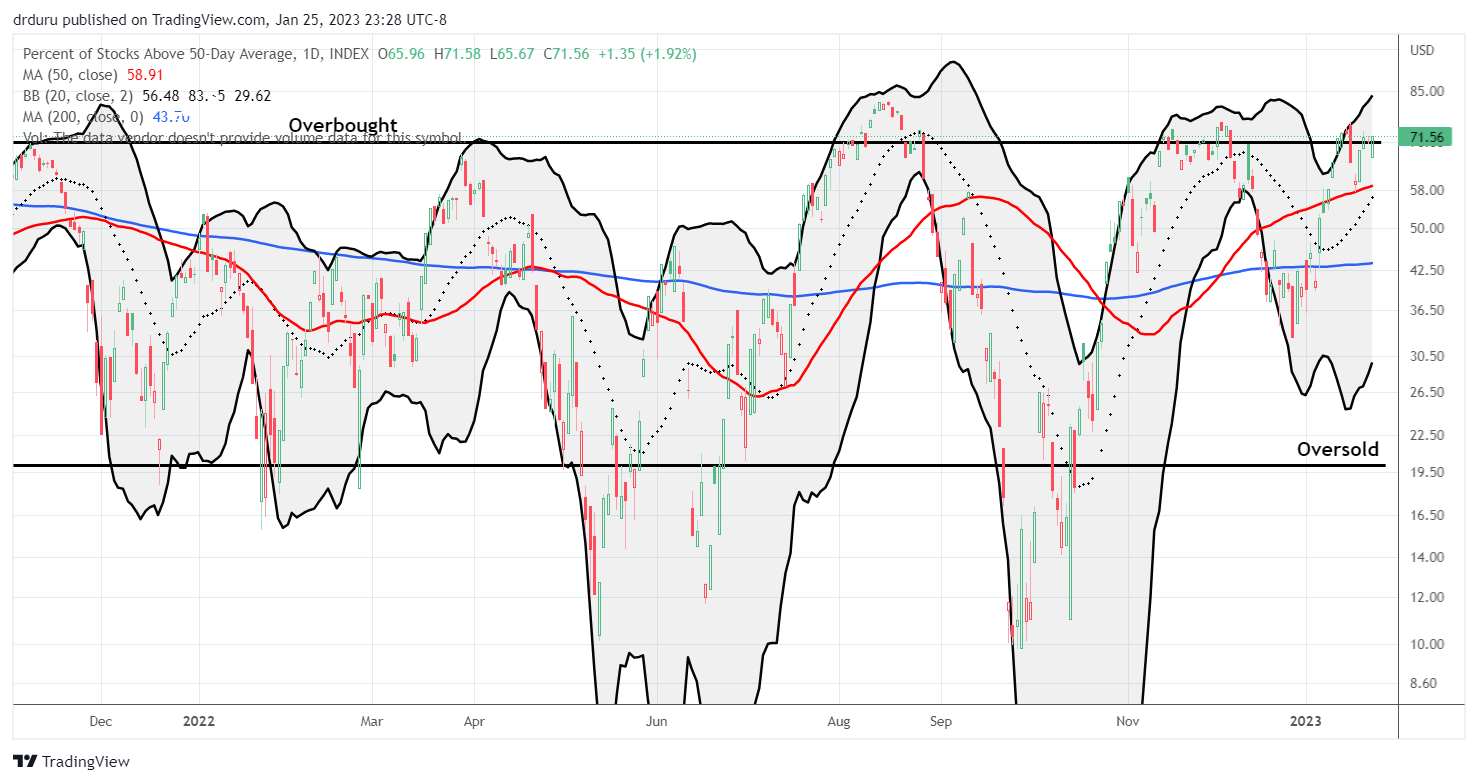
- AT50 (MMFI) = 71.6% of stocks are trading above their respective 50-day moving averages (overbought day #3)
- AT200 (MMTH) = 54.7% of stocks are trading above their respective 200-day moving averages
- Short-term Trading Call: neutral
AT50 (MMFI), the percentage of stocks trading above their respective 50DMAs, started the week back in overbought territory with a close above 70%. This push into overbought was like a confirmation of the bullish technical signals that sprouted on Friday. My favorite indicator has not made further progress but it remains overbought for the third straight day. The tepid hovering above the overbought threshold makes the bullish turn in the indices a bit tenuous. Thus, my neutral short-term trading call still seems appropriate.
After taking profits on my IWM call spread on Monday, I opened SPY call spreads with expirations this Friday and next Friday. Neither of these trades are aggressive, but they reflect the general bullish bias lingering in the major indices. I have to give deference to large reversals above key technical levels of support even with a neutral trading call. So far so good for the market’s resilience in this earnings period.
Footnotes
“Above the 50” (AT50) uses the percentage of stocks trading above their respective 50-day moving averages (DMAs) to measure breadth in the stock market. Breadth defines the distribution of participation in a rally or sell-off. As a result, AT50 identifies extremes in market sentiment that are likely to reverse. Above the 50 is my alternative name for “MMFI” which is a symbol TradingView.com and other chart vendors use for this breadth indicator. Learn more about AT50 on my Market Breadth Resource Page. AT200, or MMTH, measures the percentage of stocks trading above their respective 200DMAs.
Active AT50 (MMFI) periods: Day #70 over 20%, Day #66 over 30%, Day #15 over 40%, Day #13 over 50%, Day #10 over 60%, Day #3 over 70% (overbought)
Source for charts unless otherwise noted: TradingView.com
Full disclosure: long QQQ put spread, long SPY call spreads, long AAPL call
FOLLOW Dr. Duru’s commentary on financial markets via StockTwits, Twitter, and even Instagram!
*Charting notes: Stock prices are not adjusted for dividends. Candlestick charts use hollow bodies: open candles indicate a close higher than the open, filled candles indicate an open higher than the close.


