
The Housing Market Index (HMI) soared to 72 in July. The 14-point move completed a V-shaped recovery in the sentiment of home builders. Unlike the reaction to the surprisingly strong June HMI, the reaction to July’s surprise was definitely positive.
The Message in Home Builder Sentiment
The National Association of Home Builders (NAHB) explained the surge in the HMI with a mix of pent-up demand and the usual collection of drivers: “Builders are seeing strong traffic and interest in new construction as existing home inventory remains lean. Moreover, builders in the Northeast and the Midwest are benefiting from demand that was sidelined during lockdowns in the spring. Low interest rates are also fueling demand…” Builders are essentially expressing confidence that they can get back to business as usual.
The Housing Market Index jumped from 37 in May to 58 in June. The V-shaped recovery is all the more impressive given the trough in April sent the HMI back to the early days of the recovery from the collapse of the housing bubble.

The Message in the iShares Dow Jones US Home Construction Index (ITB)
The iShares Dow Jones US Home Construction Index (ITB) gained 1.9% in response to the HMI. This move was just enough to push ITB back to price levels last seen on February 25th. Compared to the 0.6% loss in response to the June HMI, ITB is acting much better. With a hint of follow-through on Friday, ITB finally looks poised to rally back to its 13-year high set in February just ahead of the coronavirus pandemic in the U.S. At that point, ITB will complete its own V-shaped recovery, lagged behind HMI. (Stock chart technicians may recognize a kind of bullish cup and handle pattern forming).
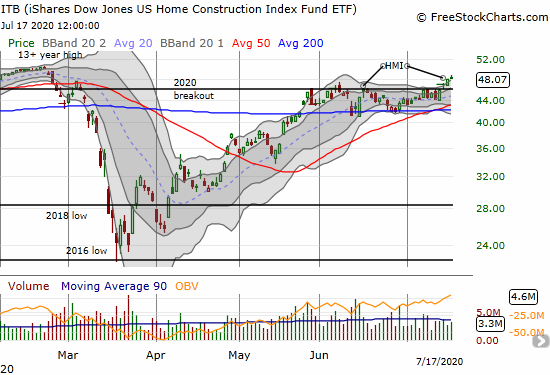
Source: FreeStockCharts
The slowly forming breakout in ITB represents the resolution of a month-long yawn over June’s good news in housing data. That period included a successful test of support at the 200-day moving average (DMA). In other words, ITB received a fresh injection of bullishness.
A Footnote from Housing Starts
Data on housing starts came the day after the HMI. June single-family housing starts increased 11.7% over May’s 746,000 annualized level. However, starts were still down 1.1% year-over-year. The chart below shows June starts are lagging well behind June/July sentiment as the peak in starts remains another 26% away. Housing starts were last at this level a year ago. July’s full recovery in HMI suggests housing starts for July should jump significantly from June.
Source: US. Bureau of the Census, Privately Owned Housing Starts: 1-Unit Structures [HOUST1F], retrieved from FRED, Federal Reserve Bank of St. Louis, July 18, 2020.
The Trade
My covered call trade in Lennar (LEN) from a month ago ended profitably with my position getting called away. LEN broke out along with ITB; LEN is just a percent or two away from the February multi-year high. I was expecting LEN to churn for longer.
I also took profits in half of my remaining position in ITB shares. I sold call options against that half and the position was called away on Friday along with LEN. I am content to sit on my remaining ITB shares although may decide to sell calls against the position as ITB approaches $50.
A new trade in ITB, or any of the other home builders that are breaking out is relatively straightforward: buy here and stop out below the breakout line. For ITB that line is around $46/share.
Be careful out there!
Full disclosure: long ITB