

Housing Market Intro and Summary
The U.S. housing market ended 2025 with mixed signals. Builder stocks are stuck in trading ranges, builder confidence has stalled, and affordability remains strained. Pockets of strength in sales activity is likely coming from a softening price environment and higher inventory levels. The data points do not tell a single, clean story. Instead, this mosaic reflects the on-going market tensions created by poor affordability dynamics
This latest update on the U.S housing market reviews what housing stocks, builder sentiment, construction activity, and sales data are signaling as the market enters 2026. Like the previous update, this review identifies where conditions are stabilizing, where risks remain elevated, and which forces – like policy, pricing, and affordability – are most likely to shape housing outcomes going into the important spring selling season.
This monthly housing update aggregates market performance, macro housing data, regional snapshots, and policy developments. Sections are designed to stand alone, with cross-links where trends intersect. Here is a summary for January’s housing market update:
- The stocks of home builders reentered a bear market after outperforming the S&P 500 to start the year.
- The recent upward momentum in home builder confidence came to an end.
- Single-family housing starts held a bottom at 800K.
- Single-family new home sales remain stuck in an extended sales range.
- Existing home sales jumped to a 1+ year high.
- California’s market for existing homes nudged to a new 3-year high.
- Georgia’s market for existing homes remains constrained by a lack of inventory despite big gains in December.
- Los Angele City Council issues conflicting signals on rental housing policy by both limiting supply and capping rents.
- Total housing inventory slipped from an 11-month high.
- Cleveland Federal Reserve President Beth Hammack addresses the limited tools available to the Federal Reserve for addressing housing issues.
- Mortgage rates dropped to levels last seen in 2024 and 2023.
Housing Stocks
The iShares US Home Construction ETF (ITB) returned to a bear market in December. The ETF of home builders started the year fast as part of an overall market rotation into formerly beaten up parts of the stock market. The resulting outperformance with the S&P 500 faded by the end of January as ITB returned to a bear market. ITB now looks stuck in a holding pattern with a trading range extending all the way back to late 2023. Thus, the seasonally strong period of trading in the stocks of home builders has turned into a game of playing the ranges.
")
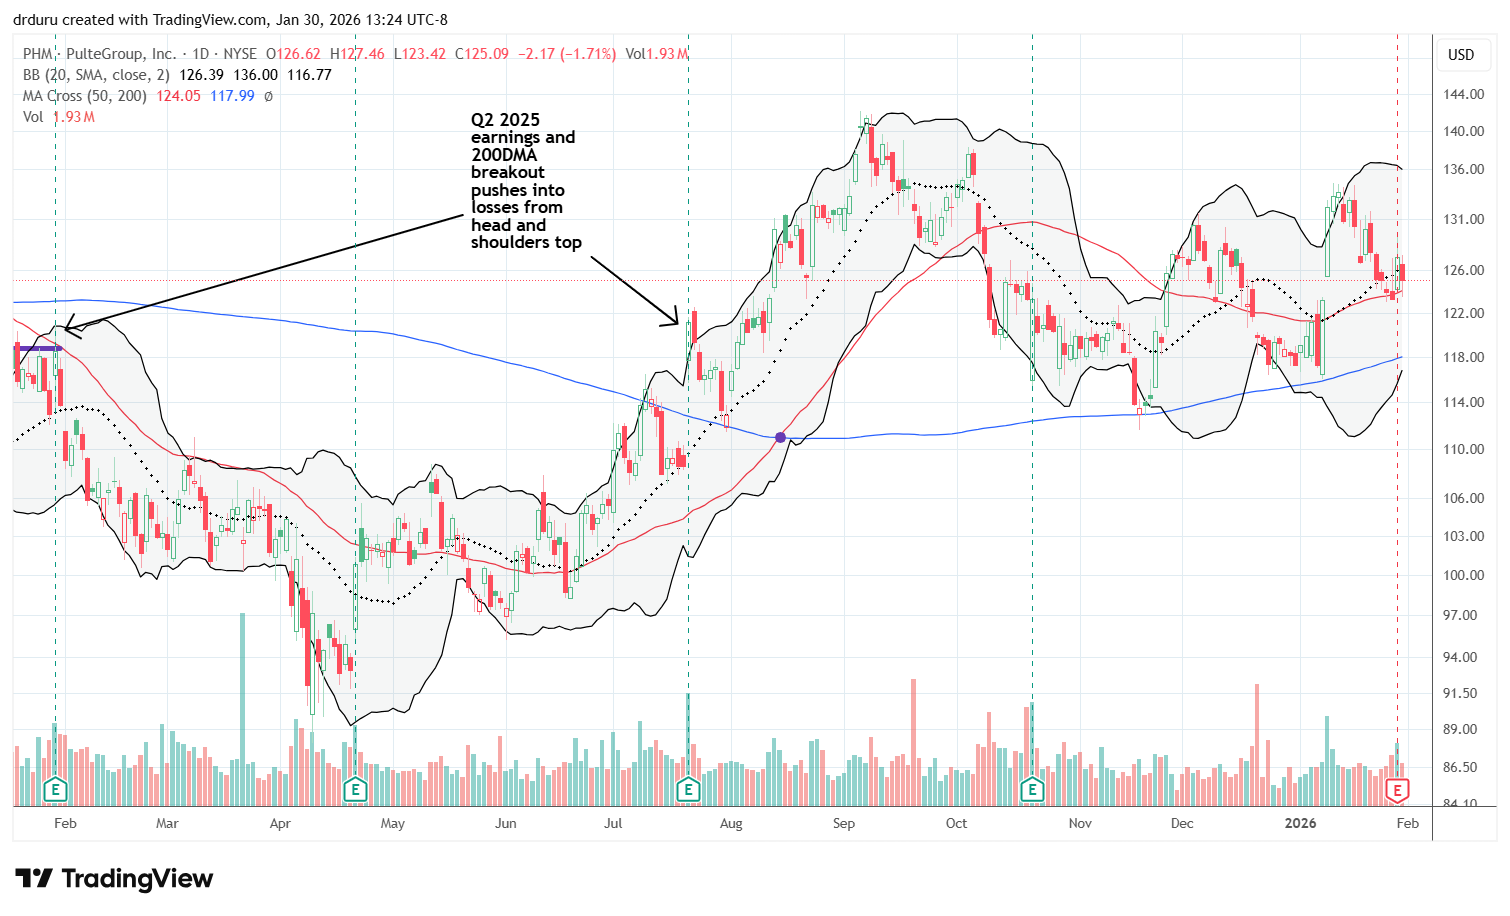
A swath of builders reported earnings in the previous weeks. Pulte Homes (PHM) was the best of the group. The stock gained 3.2% post-earnings and held support at its 50-day moving average (DMA) (the red line below). I am a bit surprised the stock was able to hold up given the company reported familiar news of softening demand creating pricing and margin pressures. With orders up year-over-year, the company is clearly focused on maintaining cash flows.
Housing Data
Home Builder Confidence: The Housing Market Index – January, 2026
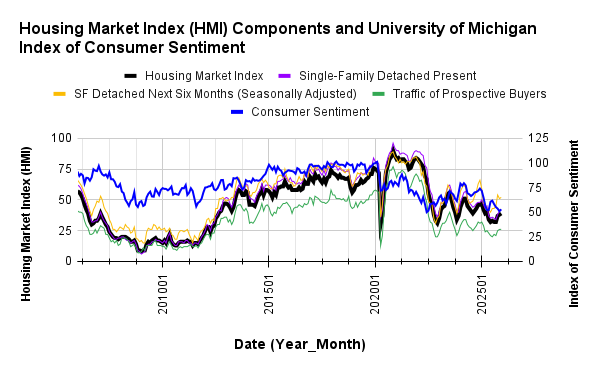
The National Association of Home Builders (NAHB)/Wells Fargo Housing Market Index (HMI) decreased 2 points to 37 in January. This drop brought the latest momentum to an end and preserves a downtrend in place since the last post-pandemic peak in 2023. The stall in builder confidence helps explain why homebuilder stocks, despite early-year strength, have failed to break out of long trading ranges.
Underlining the end of the upward momentum, the component for “Single-Family: Next Six Months”, a measure of expectations for future sales, dropped below 50 after hovering above that critical level for 3 months. The NAHB blamed “several issues that include labor and lot shortages as well as elevated regulatory and material costs”, a very familiar menu of headwinds. The industry association also suggested that the HMI could rebound in February given most of the surveys came in before the administration’s announcement of a $200B purchase of mortgage-backed bonds.
If the news of the mortgage-back bonds does not reignite enthusiasm, then the end of HMI’s momentum will put in peril the seasonal trade on home builders. (For more on the current case for the seasonal trade, see “ITB: An Affordability Push Boosts The Seasonal Trade In Homebuilders“).
/Wells Fargo Housing Market Index (HMI) and the University of Michigan Index of Consumer Sentiment")
Source for data: NAHB and the University of Michigan
Consumer and builder confidence have essentially diverged (in a relative sense). Thus January’s bounce in consumer sentiment looks like a potential bottom in a two-year downtrend. Note that consumer confidence ticked up right after setting an all-time low for this data series. A sustained bounce in consumer confidence could provide just enough spark for the housing market to finally deliver a decent spring.
While pricing pressure remain high for builders, they may have stabilized for now. The share of builders cutting prices hit a post-COVID record of 41% in November and declined just slightly to 40% in December and held at 40% for January. A 37% to 39% range had been in place since June. The average price discount declined from 6% in November to 5% in December and held at 5% in January. The share of builders providing incentives was flat from September to November at 65% but increased to “two thirds” in December and held there for January.
The Northwest continues its recent volatility, surging from 41 to 48 from December to January. The region surged from 44 to 55 in September only to plunge the next month to 45. The Midwest surged to a high for 2025 in December only to lose 5 points in January to 42. The South surprisingly declined for the second month in a row, this time from 35 to 34. The West finished 2025 at its second highest level of the year but dropped two points in January to 34.
New Residential Construction (Single-Family Housing Starts) – October, 2025
{The Census Bureau is now catching up on data reporting after the government shutdown. Housing starts data for September and October became available at the time of writing}
Single-family housing starts may have bottomed out in September. The 829K in starts matched levels last seen in early 2023. October’s 874K in single-family starts represents a 5.4% month-over-month gain but a 7.8% year-over-year decrease. Thus, the overall message is that builders remained tentative back in October even with an apparent bottoming in sentiment.
![US. Bureau of the Census, Privately Owned Housing Starts: 1-Unit Structures [HOUST1F], first retrieved from FRED, Federal Reserve Bank of St. Louis, January 9, 2026](https://drduru.com/onetwentytwo/wp-content/uploads/2026/01/20260109_Housing-starts-October-2025.png "Housing starts")
In a likely sign confirming bottoming builder sentiment, building permits continued a process of stabilization in place since June. Permits declined fractionally from September to October and are down 9.4% year-over-year. Permits increased 0.5% from June but still declined 7.9% year-over-year. Since June, 2024, permits have declined year-over-year. September permits were a high for this stabilization period.
There were wide divergences in regional starts. Month-over-month the changes were +44.2%, +22.6%, +8.2%, and -21.5% for the Northeast, Midwest, South, and West respectively. Year-over-year the West was a big loser. The Northeast, Midwest, South, and West each changed +17.2%, +0.7%, -2.9%, and -31.6%.
New Residential Sales (Single-Family) – October, 2025
{The Census Bureau resumed reporting after the impact of the government shutdown but has only caught up to October’s data}
After new home sales surged in August, I expected significant downward revisions with the breakout remaining marginally intact. Even the NAHB made it clear that future revisions will likely bring this sales number down. Surprisingly, not only did the August surge remain fully intact, but also the subsequent two months of sales did not come back down. Sales declined ever so slightly by 0.1% from September to October, but surged 18.7% year-over-year to 737K new single-family homes sold.
The Mortgage Bankers Association estimated December sales increased 7% year-over-year but plunged 15.2% to 640,000 annualized units.
The resilience in new home sales appears less driven by organic demand and more by aggressive price concessions, incentives, and smaller home sizes. These strategies are paying off particularly well with mortgage rates declining to and past 6%.
![US. Bureau of the Census, New One Family Houses Sold: United States [HSN1F], first retrieved from FRED, Federal Reserve Bank of St. Louis, January 14, 2026](https://drduru.com/onetwentytwo/wp-content/uploads/2026/01/20260114_New-home-sales-October-2025.png "new home sales")
For August, the median price for new homes jumped to the top of the current downtrend channel. For October, the median price dropped toward the bottom of the channel. to $392,300, marking a 3.3% sequential decline and an 8.0% year-over-year plunge. The presumed $400,000 floor is now broken with the trend indicating more declines to come. Clearly, builders are keeping sales aloft by pushing price down and building smaller homes.
The share of homes priced under $300,000 is back to levels last seen in July and is up significantly from 14% a year ago to 25%. All prices ranges from $400,000 to $999,999 declined with the most significant decline at the lower part of the range. The million dollar and higher homes gained sequentially and month-over-month from 5% to 6% share. The decline from August’s 7% and peak of the year, also helped to drive the sequential declines in home prices.
August’s inventory was revised upward significantly from 7.4 months of sales to 8.3. September and October inventory fell to 7.9 months of sales compared 9.3 a year ago. The overall story is that the inventory of new homes is drifting back toward balance as builders are apparently focused on selling down inventories as evidenced by the drop in price and jump in sales. The absolute inventory continued to decline as September’s inventory sat at 488K, down from August’s 493K. October inventory was flat with September. Even with inventory drifting toward balance, affordability remains a binding constraint. Thus, supply normalization will not likely fully translate into sustained demand.
A large recovery in sales in the South is almost the entire story for the surge in sales. The South was the only region with a sequential gain in sales. The Northeast and the West even suffered significant declines. The Northeast, Midwest, South, and the West changed -40.0%, +21.3%, +42.1%, -24.8% respectively year-over-year. Presumably, each region will experience downward revisions.
Existing Home Sales – December, 2025
December’s existing home sales soared and validated the sudden jump in new home sales. December’s existing home sales increased 5.1% month-over-month and increased 1.4% year-over-year. (The National Association of Realtors indicated sales were near a 3-year high. The reported year-over-year decline appears inconsistent with other data and may reflect a reporting error). The market for existing home sales clearly came alive in December, a very surprising and unseasonal surge.

(For historical data from 1999 to 2014, click here. For historical data from 2014 to 2018, click here) Source for chart: National Association of Realtors, Existing Home Sales© [EXHOSLUSM495S], retrieved from FRED, Federal Reserve Bank of St. Louis, January 14, 2026

Absolute inventory plunged sequentially 18.1% to 1.18M unsold homes but still increased 3.5% year-over-year. According to the NAR, there is a “3.3-month supply of unsold inventory, down from 4.2 months in November and up from 3.2 months in December 2024”. Absolute inventory increased on a year-over-year basis for an 11th straight month but current trends point to an imminent year-over-year decline resuming, a situation which will cause a fresh headwind for existing home sales.
The median sales price of an existing home set a record in June at $432,700 and has trended downward ever since. December’s median price of $405,400 continued the decline with a 1.1% drop from November. The median price still extended its streak of year-over-year price increases to 30 months with a slight 0.4% gain.
The median time on the market for an existing home for sale ranged from 31 days for the $100 to $250K price range to 35 days for three other price ranges. This month, the NAR did not report on the overall average time on market.
Also this month, the NAR did not report on the breakdown in sales across different segments like first-time home buyers.
The South was the only region to gain in sales year-over-year. The regional year-over-year changes were: Northeast -1.9%, Midwest flat, South +3.6%, West flat.
Single-family existing home sales increased 5.1% to 3.95M in December and increased by 1.8% year-over-year. The median price of a single-family home was $409,500, up 0.2% year-over-year and down 1.3% month-over-month.
California Existing Single-Family Home Sales – December, 2025

The California Association of Realtors (C.A.R.) is optimistic for 2026 given an encouraging finish to 2025, a small change in tune from the tempered tone in the last report. C.A.R. claimed that “as price growth eased toward the end of the year and mortgage rates fell to near-three‑year lows, the stage is set for a more optimistic 2026″. As a result the C.A.R. expects “a healthier, more balanced market” that offers more opportunities for buyers. In the meantime the data overall shows just subtle changes.
California’s existing single-family home sales reached a 3-year high in November and barely inched higher by 0.3% in December to 288,200, also a 2.0% year-over-year increase. The median price decreased 0.4% month-over-month and down 1.2% year-over-year to $850,680, a 10-month low. The median price per square foot dropped from $423 in November to $408 also down from $413 a year ago. The sales-price-to-list-price ratio slipped after remaining flat for two months. December’s 97.8% ratio was also down from 98.7% a year ago.
December’s unsold inventory index (UII), which measures the number of months needed to sell the supply of homes on the market at the current sales rate, decreased from 3.6 in November to 2.7, also flat with the year ago level. Despite the sudden plunge in the UII, total active listings increased for the 23rd month in a row, but the rate of growth has declined for 8 straight months and the smallest since February 2024. I previously thought this downtrend could slow down the housing market, but I will defer to the optimism of the C.A.R. for now.
The median time on market stayed increased from 31 a year ago to 36. This increase is a fresh reminder of a slowing market but could also reflect the increase in inventory giving buyer’s more options to consider.
California continues to illustrate how rising inventory does not automatically create price relief in high-cost markets.
Georgia’s Housing Market – December, 2025
The following infographic was created from Notebook LLM based on the December Georgia housing data posted by the Georgia Association of Realtors. (Note that the GAR does not clarify whether the reported percentage changes are month-over-month, year-over-year, or a mix).
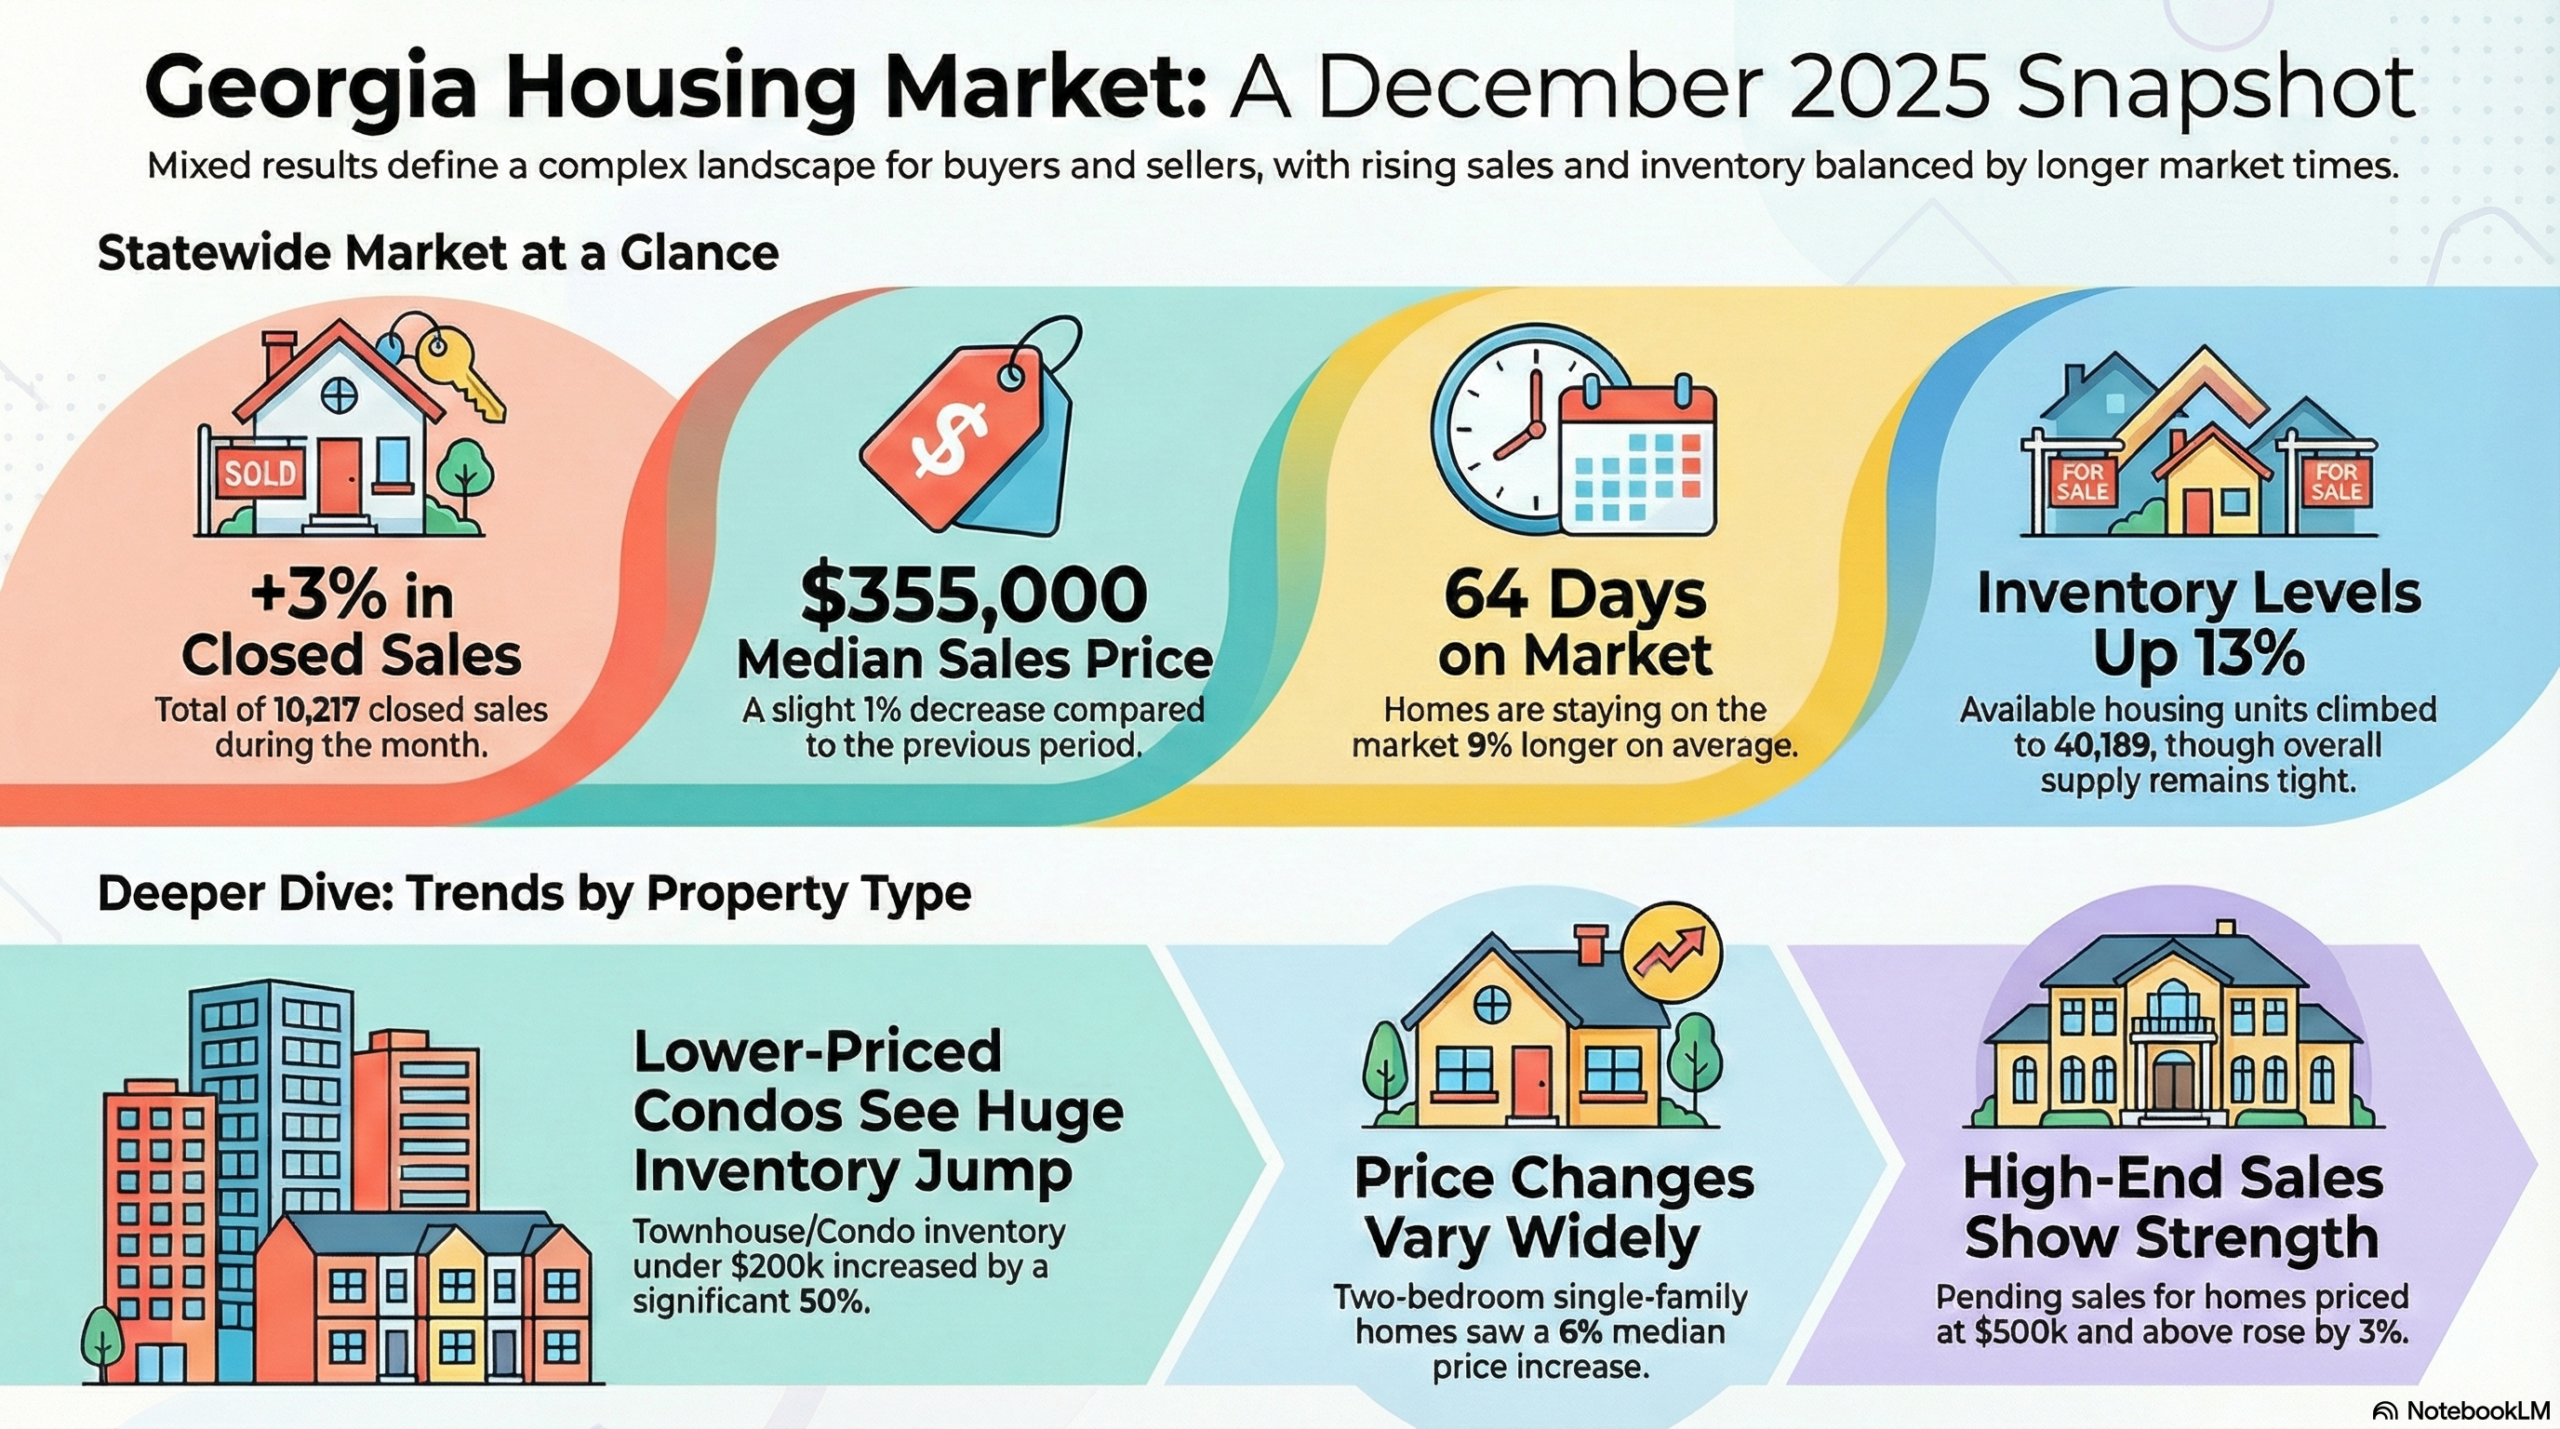
The Association noted large increases in inventory but still cautioned that “lack of inventory remains a challenge throughout the state”.
Georgia’s data highlights how inventory growth can coexist with persistent affordability challenges.
Home closing thoughts
Los Angeles City Council Invents Its Own Rental Economics (Policy Context)
The Los Angeles City Council wants to control the cost of rental housing. In a political version of trying to have the cake and eat it too, the local government implemented rent control after banning the building of new apartment buildings in many neighborhoods. There are many reasons why California struggles to address its affordability challenges for housing. A counterproductive confluence of government actions sits right in the center of the storm, prominently featuring politics over economics.
My “solution” in some alternate reality would be to force (California) governments to build, run, and maintain affordable housing so that lawmakers would directly grapple with the confounding realities of regulations, rising costs of inputs, rising insurance costs, property taxes, and wage growth too slow to keep up with rising costs. Of course the likely outcome of such a solution would be a deeper encroachment of the government into all areas of housing with politicians struggling to regulate all the prices impacting the affordability of government housing.
“New home building faces stiff opposition in many LA neighborhoods. The LA City Council recently voted not to allow new apartments in most of the city’s residential areas. And on rent control, the council ultimately decided to cap increases at 4%. Under the rules, nearly 70% of tenants will be covered.”
(For a hopeful exploration of public housing policy, see the results of an economic study of the Hope Project called “This housing program helped kids escape poverty — by changing who they befriended” from Planet Money).
AI Building Homes?
Marketplace recently covered CBH Homes based in Boise, Idaho, a company fully integrating AI in its home development processes. The company uses AI to analyze data and for sales follow-up. AI helps the company triage customer issues 24/7 and manage long-term sales relationships so human sales people can focus more on immediate prospects. For example, the warranty department uses AI as the first point of contact. Under the motto “speed wins”, the company uses AI to make existing employees more productive and to enable growth of the company, including hiring people.
For now, AI adoption by builders is best understood as a response to labor shortages and margin pressure rather than a driver of demand.
Institutional Buyers May Be Banned from the Market
In early January, the President threatened to ban institutional investors from buying single-family homes. He called on Congress to act. This push for affordability runs counter to the data that suggests institutional investors only own 1% of all single-family homes and even recently reduced their overall holdings. Thus, it is little surprise this proposal became watered down by the time the President reiterated his outline on housing affordability in Davos.
Total Housing Inventory Dips from 11-Year High
The NAHB provided an update on total housing inventory, a combination of new and existing homes. The NAHB attributed a reduction to lower buyer demand and slower construction activity. At 4.9 months of sales, total inventory remains far short of the 6 months of sales considered to represent a balanced market.

Hammack Talks Affordability for the 4th District
Cleveland Federal Reserve President Beth Hammack addressed housing affordability at a speech at the University of Cincinnati Real Estate Center Roundtable. She described discussions with construction companies and builders which revealed several problems outside of the Federal Reserve’s control. These housing insiders complained about the rising price of materials and labor and the reduced labor supply.
Hammack took her findings and asked her team for ideas to support workforce development through training programs and other alternatives to a four-year college. Hammack pointed to Lorain County Community College in Northeast Ohio as a potential example by noting “they have a couple of great programs that help train people for medical professions…whether it’s nursing or other healthcare technicians”. Lorain is also preparing student to work as technicians in semiconductor chip factories. This kind of alternative offers an economical approach to expanding and skilling the workforce.
Ultimately, Hammack reminded the audience that “fiscal and government policy is better suited to putting in place those types of programs”. The Fed’s role is limited to offering research findings to policymakers. “Monetary policy is a pretty limited blunt tool” lamented Hammack. Interest rates are just a small part of the picture given the Fed cannot directly control mortgage rates.
Spotlight on Mortgage Rates…And Affordability
The Mortgage Bankers Association (MBA) reported two weeks with a decrease in mortgage applications and two weekly increases for the month of January. For all of December, new home purchase mortgage applications increased 2.5% year-over-year and dropped 3% sequentially. The MBA expects “new home sales in 2026 will increase gradually” assuming that both mortgage rates and sales price growth remain roughly thanks to “excess inventory”.
![Freddie Mac, 30-Year Fixed Rate Mortgage Average in the United States [MORTGAGE30US], retrieved from FRED, Federal Reserve Bank of St. Louis; December 29, 2026.](https://drduru.com/onetwentytwo/wp-content/uploads/2026/01/20260129_30-Year-Fixed-Rate-Mortgage-Average-in-the-United-States.png)
Be careful out there!
Full disclosure: long ITB shares