Stock Market Commentary:
After some good economic data, the stock market looks quite wary ahead of the coming Federal Reserve meeting on Wednesday. After two swift down days to start the week, the stock market did its best job clinging to support and the lows of the week. The tenuous positioning is further weakened by a breakout of volatility and significant deterioration in the market breadth indicators.
The Stock Market Indices
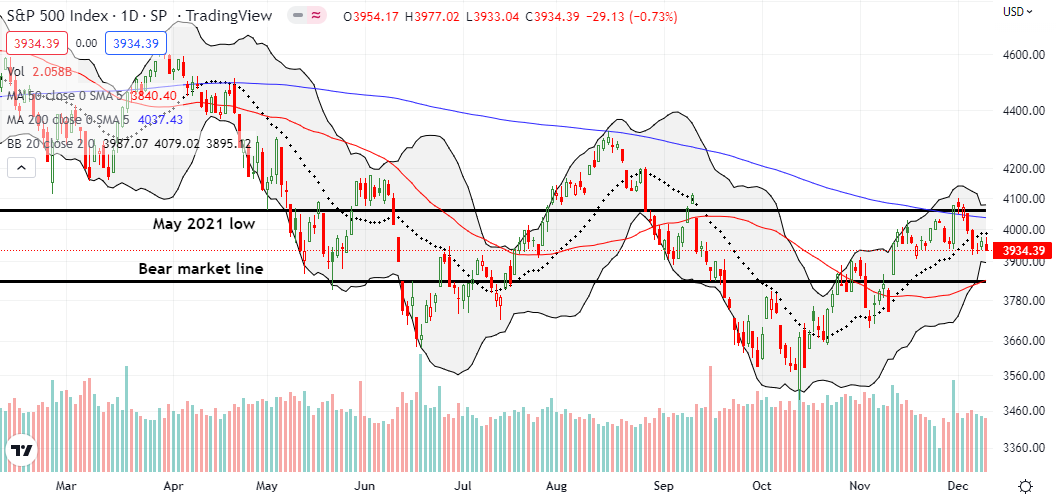
The S&P 500 (SPY) lost 0.7% and printed its lowest close of the week. The move marginally confirmed a breakdown below the 20-day moving average (DMA) (the dotted line below). Three days earlier, the index confirmed a 200DMA breakdown (the blue line below). Thus, the S&P 500 looks ready to continue lower into a key test of converged support at the bear market line and the now uptrending 50DMA (the red line below). The index is clinging to a hope that it can avoid this test no matter what the Federal Reserve delivers in Wednesday’s decision on monetary policy.
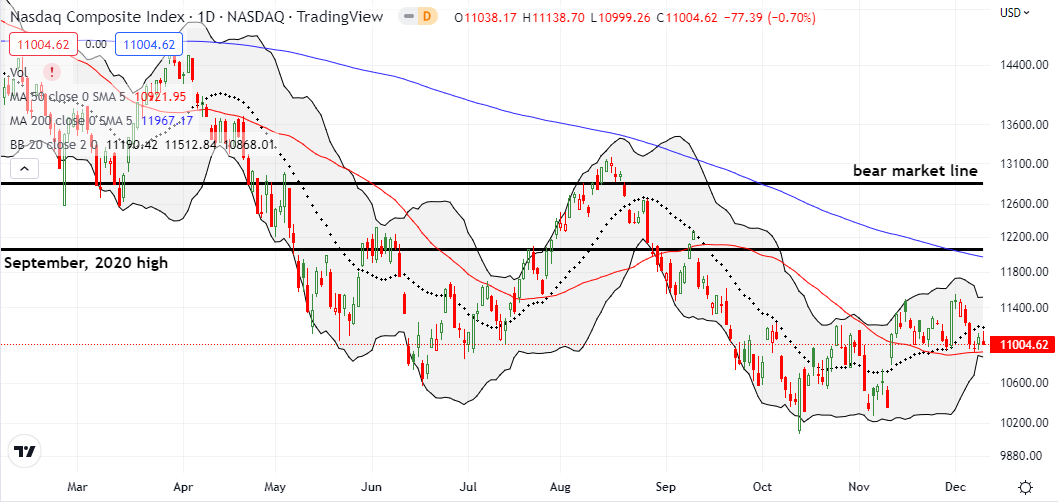
The NASDAQ (COMPQ) made a valiant effort defending 50DMA support after the week started with two days of selling. Friday’s 0.7% loss suggests that the tech-laden index is clinging to this support. A 50DMA breakdown would set up an eventual retest of the October lows. If the Fed news is bad enough to force the breakdown, then I doubt the October lows will hold this time around.
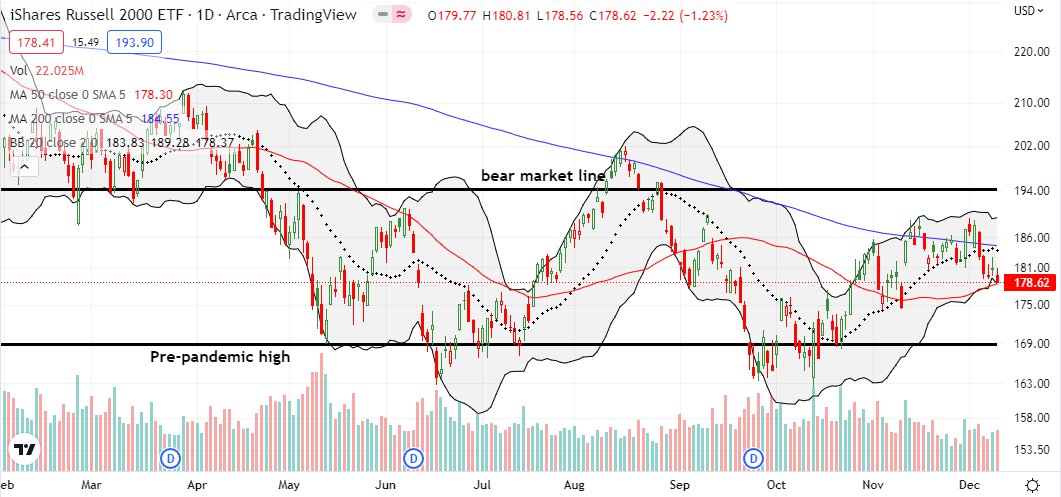
The iShares Russell 2000 ETF (IWM) is in the most precarious position of the major indices. The ETF of small cap stocks lost 1.2% and closed clinging to 50DMA support. Ironically, IWM was the strongest of the bunch over the past month or so with two 200DMA breakouts. The S&P 500 had one brief 200DMA breakout. The NASDAQ did not come close. A 50DMA breakdown for IWM from here would set up a fresh test of the pre-pandemic high.
Stock Market Volatility
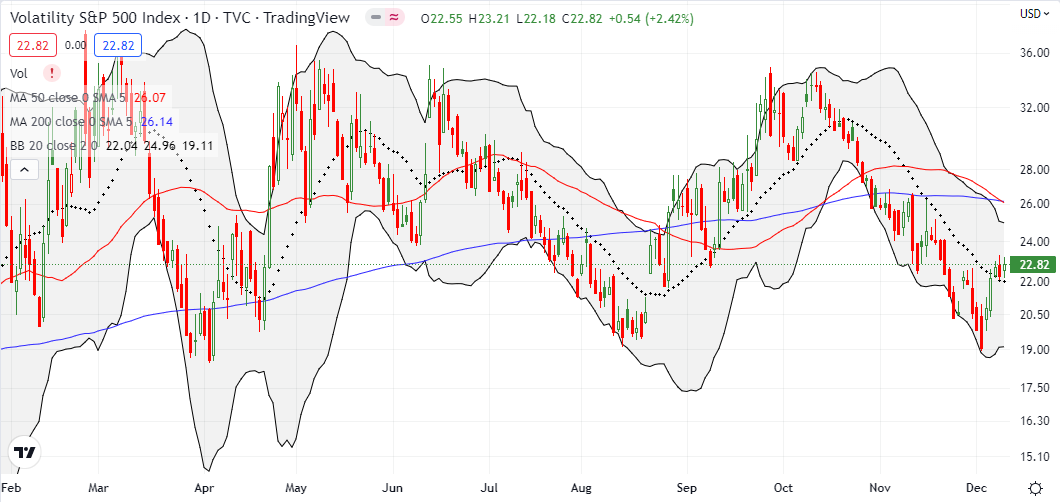
In my last “Market Breadth” post, I pointed out how the volatility index (VIX) was positioned to end its downtrend. Two days later, the VIX indeed broke out above the dashed line that defined the downtrend since late October. While Friday’s selling did not close the VIX at a high for the week, the VIX still looks positioned for higher levels. This yellow flag for what the Fed has planned for financial markets leaves buyers clinging to hope.
The Short-Term Trading Call While Clinging to Support
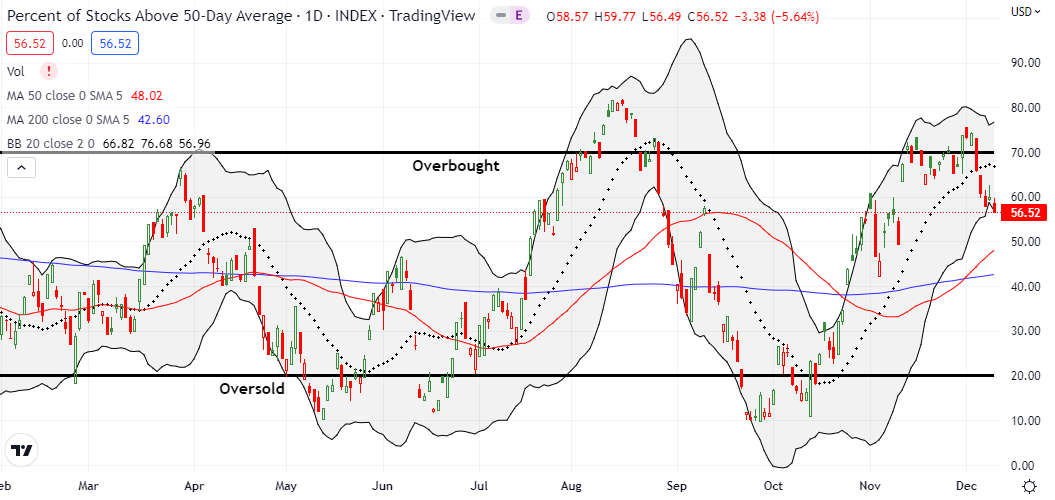
- AT50 (MMFI) = 56.5% of stocks are trading above their respective 50-day moving averages
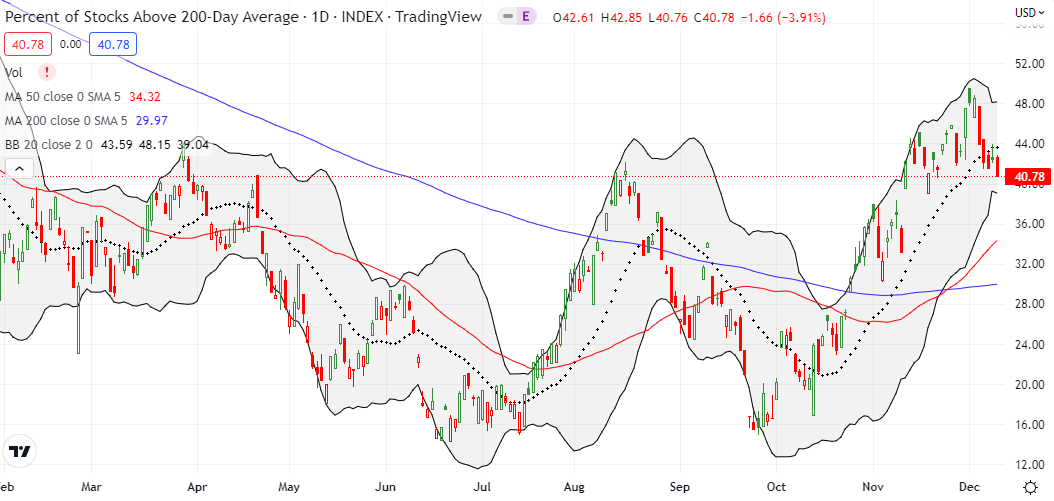
- AT200 (MMTH) = 40.8% of stocks are trading above their respective 200-day moving averages
- Short-term Trading Call: cautiously bearish
AT50 (MMFI), the percentage of stocks trading above their respective 50DMAs, fell to a 1-month low – no clinging here. My favorite technical indicator is signaling lower levels to come. Monday’s drop from overbought conditions flipped my short-term trading call back to (cautiously) bearish, and Tuesday’s selling confirmed that call more definitively than previous drops.
AT200 (MMTH), the percentage of stocks trading above their respective 200DMAs, looks even more telling. After a bullish breakout that took AT200 close to its high of the year, this longer-term indicator suffered a setback below the previous high in August. Friday’s close fully reversed the bullish breakout.
Now, I just wait to see how the market survives the Fed. Will Chair Jerome Powell choose to break the market, or will he try to save the market just in time for Christmas?
Be careful out there!
Footnotes
“Above the 50” (AT50) uses the percentage of stocks trading above their respective 50-day moving averages (DMAs) to measure breadth in the stock market. Breadth defines the distribution of participation in a rally or sell-off. As a result, AT50 identifies extremes in market sentiment that are likely to reverse. Above the 50 is my alternative name for “MMFI” which is a symbol TradingView.com and other chart vendors use for this breadth indicator. Learn more about AT50 on my Market Breadth Resource Page. AT200, or MMTH, measures the percentage of stocks trading above their respective 200DMAs.
Active AT50 (MMFI) periods: Day #39 over 20%, Day #35 over 30%, Day #33 over 40%, Day #21 over 50%, Day #3 under 60%, Day #5 under 70%
Source for charts unless otherwise noted: TradingView.com
Full disclosure: long IWM calendar call spread, short IWM put spread, long SPY calendar call spread
FOLLOW Dr. Duru’s commentary on financial markets via StockTwits, Twitter, and even Instagram!
*Charting notes: Stock prices are not adjusted for dividends. Candlestick charts use hollow bodies: open candles indicate a close higher than the open, filled candles indicate an open higher than the close.


The last Fed meeting, the market creatively misinterpreted Powell’s remarks, opening the door to considerable volatility.
Powell and the other Fed governors have not all been on the same page lately, in contrast to his entire previous history. I think there is genuine dissent across the Fed governors about how much (more) to raise, and how quickly. This week’s expected 50 BP raise looks to me like a compromise. I will be intensely interested to see whether Powell follows the traditional practice of noting dissenting governors by name and their preferred course. Anything else would be a shocking reduction in transparency.
any thoughts on the VIX and SPX both being up on same day. Have not seen that in a while.
THAT was extremely bizarre! But theoretically it can happen if you have a lot of S&P 500 put buyers AND buyers of equities. If I learn anything specific, I will post it here.