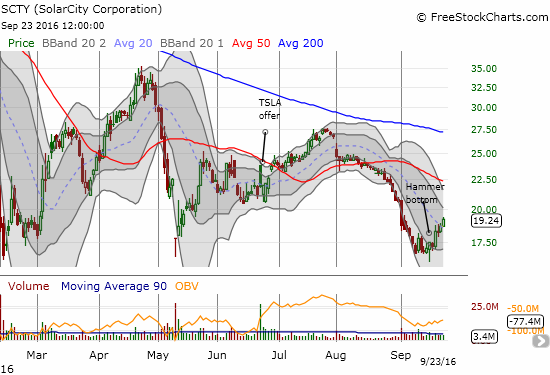
A week ago, I discussed the setup for the next pairs trade going short Solar City (SCTY) and long Tesla Motors (TSLA). The technicals of SCTY and TSLA suggested a (short-term) bottom in the making. The latest charts suggest a confirmation of those bottoms, especially for Solar City. The follow-through confirmation came 2 days after the bottoming hammer pattern with a 6.4% surge on decent volume. SCTY ended the week with a strong 9.9% increase.

Source: FreeStockCharts.com
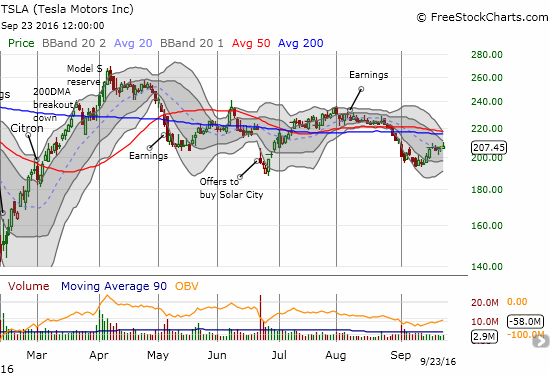
TSLA’s bottom is not nearly as emphatic as SCTY’s. TSLA barely gained any points for the week after the previous week’s trading successfully retested the June lows.

Source: FreeStockCharts.com
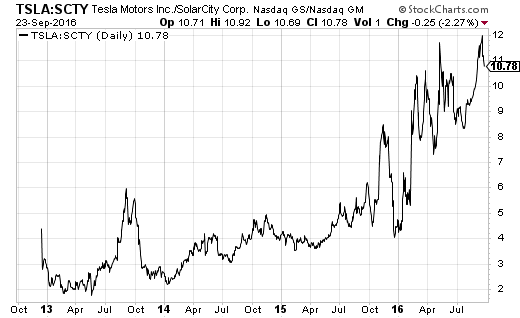
The difference in follow-through between SCTY and TSLA also confirms what I suspected was a top in the TSLA/SCTY ratio.

Source: StockCharts.com
As the technicals unfolded as I anticipated, I also executed my second pairs trade as planned. I selected a December expiration whereas the first pairs trade only had two weeks to succeed. Since the options on both SCTY and TSLA are so expensive three months out, I bought spreads to remove a good chunk of the premiums for time and volatility. Of course, I am trading off on the prime bearish scenario for SCTY which is TSLA failing to execute the buyout whether from lack of shareholder support, financing, or another contingency. If the rally in SCTY continues, I will wait until at least a reversal of all of September’s loss before considering a repositioning.
Be careful out there!
Full disclosure: long SCTY put spread, long TSLA call spread
