
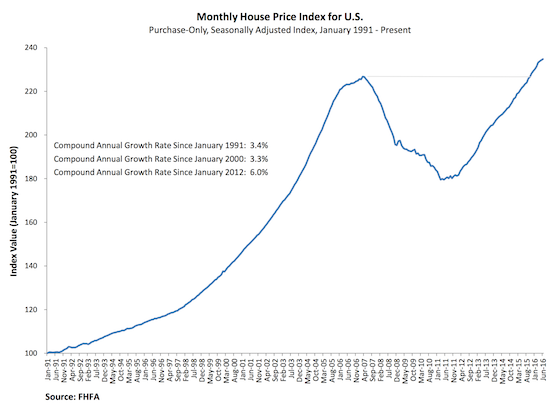
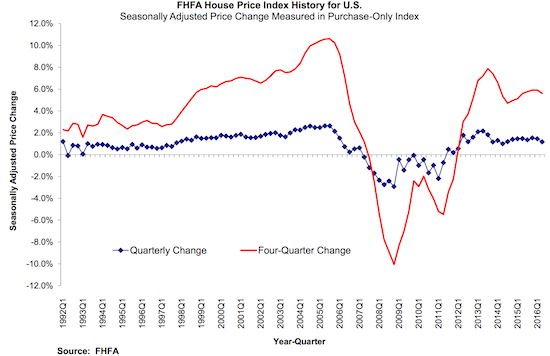
Today, the Federal Housing Finance Agency (FHFA) released its quarterly report on U.S. home prices for Q2 2016. Home prices rose 5.6% but each month in the quarter increased “only” 0.2% sequentially. This monthly pace represents a substantial slowdown from the first quarter where monthly gains were 0.4%, 0.5%, and 0.8%. The FHFA speculates that poor affordability is driving the deceleration, but it is too early to make a final conclusion (for greater context, see the charts below: price appreciation on a quarterly basis has changed little for the past two years). The FHFA notes that over the past five years, home prices have far outpaced the growth in household incomes: 30% versus 10% to 15%. (The data come from the video accompanying the release).
The West is leading the way in annual price increases but, surprisingly, California is not on the list of the top five states in price appreciation: 1) Oregon 11.7%; 2) Washington 10.3%; 3) Colorado 10.2%; 4) Florida 10.0%; and 5) Nevada 9.6%. California is at #10 with an annual gain of 7.2%. The FHFA notes the top 5 states also led the way in the first quarter. Something tells me that California “escapees” are helping to drive these prices. In my last post on housing “U.S. Migration Patterns and California Housing Migraines,” I focused on the potential of Californians migrating southward to Texas and Florida. I did not specifically call out how the Western states of Oregon, Washington, Nevada, and Colorado, were among the top 10 states benefiting from domestic migration. The robust price gains in those states likely confirm that these strong migration patterns continue.
The members of the top 5 shift relative to the past 5 years of price appreciation: 1) Nevada 79%; 2) Arizona 67%; 3) California 59%; 4) Florida 56%; 5) Colorado 53%. Oregon slips to #6 with a 51% gain. (Data from the complete report).
Finally, the Northeast dominates the list of laggard states. Connecticut has had the lowest price appreciation over the past 5 years at 0.2%. Other states in the single digits are New York (9.5%), Vermont (8.1%), and New Jersey (7.9%).
Source: FHFA