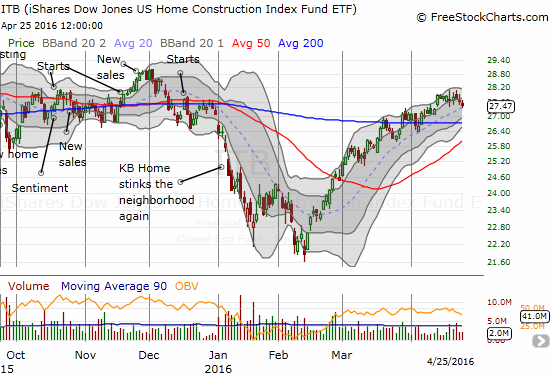
The last Housing Market Review covered data released in March, 2016. At the time, the iShares US Home Construction ETF (ITB) was accompanying the market on an extended rally from the February lows. Resistance at the 200-day moving average (DMA) slowed down the advance. THIS month, ITB cleanly broke through resistance only to come to a halt after a promising gap up. I took profits on a few more positions in home builders as the seasonal trade in home builders winds down. I discuss my go-forward trading strategy under “Parting Thoughts.”
Source: FreeStockCharts.com
Aggregate housing data this month did not deliver any bullish upside surprises. So, I feel justified continuing to take profits. Note well, I am NOT bearish on home builders. Instead, I find the risk/reward for holding home builders to be a lot less favorable here relative to the current rally and the momentum in the housing data.
New Residential Construction (Housing Starts) – March, 2016
In the last Housing Market Review I cautiously noted how one-by-one the indicators of health for the housing market were peeling off leaving housing starts as the lone clear stand-out. This month, this indicator took a serious stumble.
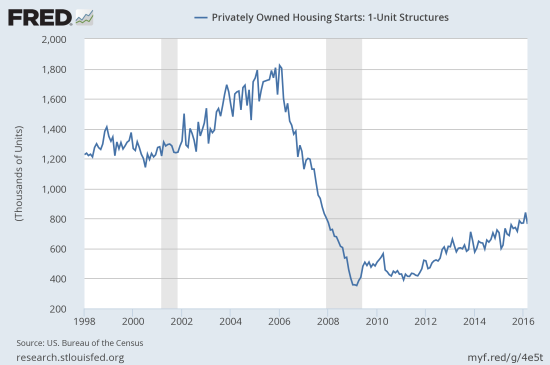
Privately owned housing starts for 1-unit structures came in at 764,000 for March. The February 1-unit starts were revised upward to 841,000 from 822,000. So, the month-over-month change was -9.2%. The year-over-year growth was still a blistering 22.6%. The chart below shows how the large monthly decline did not end the still strong uptrend.
Source: US. Bureau of the Census, Privately Owned Housing Starts: 1-Unit Structures [HOUST1F], retrieved from FRED, Federal Reserve Bank of St. Louis, April 19, 2016.
All regions of the U.S. experienced double-digit year-over-year gains in 1-unit housing starts. The Midwest led with a 41.4% burst higher. However, this region also had the worst monthly performance with a 21.2% drop.
While housing starts missed “expectations,” I think this slowdown could be a natural response to the way the previous pace was starting to get ahead of sales and sentiment. Let’s see whether the uptrend can hold in coming months even has sales of new homes appear to plateau for this cycle and inventories remain well-balanced with demand (see below).
Existing Home Sales – March, 2016
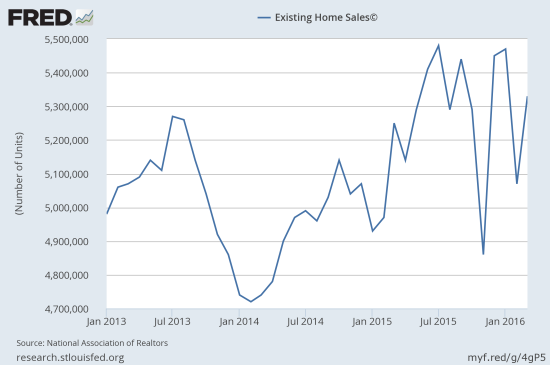
It turns out that February’s large month-over-month drop in existing home sales was likely a blip. The issues of affordability and supply suddenly turned into surmountable problems. From the National Association of Realtors (NAR):
“Lawrence Yun, NAR chief economist, says home sales had a nice rebound in March following February’s uncharacteristically large decline. ‘Closings came back in force last month as a greater number of buyers – mostly in the Northeast and Midwest – overcame depressed inventory levels and steady price growth to close on a home,’ he said. ‘Buyer demand remains sturdy in most areas this spring and the mid-priced market is doing quite well. However, sales are softer both at the very low and very high ends of the market because of supply limitations and affordability pressures.'”
In the last Housing Market Review, I wondered aloud whether February could prove to be a blip:
“I am wondering whether it is also possible that a lot of demand was pulled forward into January for some reason. January’s existing sales were last that high six months prior. On a year-over-year basis, February’s existing home sales still increased 2.2%, but they dropped 7.1% from January. This is not the kind of momentum expected or desired going into the Spring selling season. However, if there was some kind of pull-forward effect in January, then February should look like a blip as the season pushes into March and April. We will see soon.”
With the momentum returning in time for the Spring selling season, single-family homes performed impressively. Only the West suffered a year-over-year decline in existing sales (-2.5%).
“Single-family home sales increased 5.5 percent to a seasonally adjusted annual rate of 4.76 million in March from 4.51 million in February, and are now 2.6 percent higher than the 4.64 million pace a year ago. The median existing single-family home price was $224,300 in March, up 5.8 percent from March 2015.”
Source: National Association of Realtors, Existing Home Sales© [EXHOSLUSM495S], retrieved from FRED, Federal Reserve Bank of St. Louis, April 24, 2016.
Note that the NAR recently withdrew a large chunk of data from the St. Louis Federal Reserve’s database of economic indicators. So if I need to make historical comparisons in the future, I will need to pull out archived snapshots of the graphs. Too bad I did not save the data, but at least I have the charts! Here is the info I got from FRED:
“The St. Louis Fed and the National Association of Realtors have reached a new data licensing agreement that will go into effect March 17, 2016:
Removed series: All annual existing home sales series will be removed from FRED and its associated services. All series under the Existing Home Sales and the Monthly Housing Affordability Index releases will be removed from ALFRED.
Revised series: Subject to availability, FRED will provide monthly series of seasonally adjusted existing home sales and monthly housing affordability indexes with observations from 2013 to the present. Monthly non-seasonally adjusted existing home sales series will be available in FRED for the prior 13 months.”
Although housing inventory increased 5.9% from the prior month, inventory is still down 1.5% from a year-ago – a slightly larger year-over-year decline than the prior month. Months of inventory increased from 4.4 months to 4.5 months, still far short of the 6 months typically indicative of a balanced market. Recall that December’s inventory of 3.9 months was the lowest since 3.6 months of supply in January, 2005. The lack of supply response from the market of existing homes remains one of the more remarkable features of today’s housing dynamics. March’s 5.7% year-over-year increase in the median price of an existing home represents the 49th consecutive month of year-over-year increases.
Interestingly, individual investors retreated from last month’s 18% share of existing sales and dropped to 14%. This is the same level as a year ago, so there is no real alarm here. These sales are also still above the 12% trough in August, 2015 and recall that the prior month’s 18% share was the highest seen since April, 2014.
First-time homebuyers are still stuck in neutral. Their share of purchases sits at the same 30% from last month, a year-ago, and 2015’s average.
New Residential Sales – March, 2016
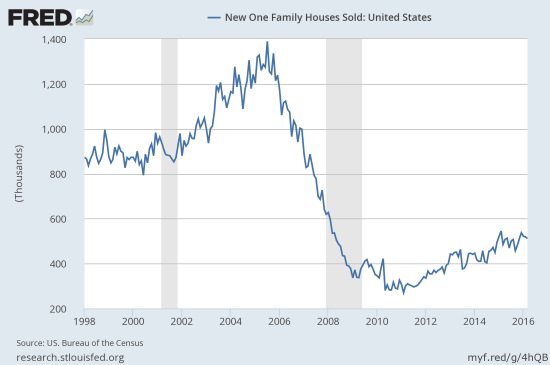
New single-family home sales came in little changed from February’s upwardly revised total of 519,000. March’s 511,000 single-family home sales represent an increase of 5.4% year-over-year (housing bears of course chose to focus on the third straight monthly decline). In the last Housing Market Review I concluded that a selling range is likely developing. With the Spring selling season underway, the range seems even more likely. Assuming the selling season has indeed peaked around current levels, the seasonal trade on home builders must also be coming to an end.
Source: US. Bureau of the Census, New One Family Houses Sold: United States [HSN1F], retrieved from FRED, Federal Reserve Bank of St. Louis, April 25, 2016.
New home inventory stayed flat at 5.8 months. This level remains closely in-line with the six months typically considered balanced.
The regions were even more mixed in performance than the previous month. The Northeast proved volatile yet again as March’s 30% year-over-year gain is a dramatic turn-around from February’s 3.8% drop. January’s new home sales in the Northeast soared 100% year-over-year. The Midwest and the South gained 10.3% and 15.4% year-over-year respectively. Thus, my concern for Texas has eased. The West returned to a steep loss with a year-over-year decline of 20.7%. Combined with lackluster existing home sales, I am starting to worry a bit about the West. The West dropped 24.1% year-over-year in January and gained 10.2% in February.
Home Builder Confidence: The Housing Market Index– April, 2016
After a worrisome February, the Housing Market Index (HMI) has stabilized at 58 for the third consecutive month. The overall stabilization still hides some disappointing numbers underneath. This month, it seems the traffic of prospective buyers helped prop up the overall index. However, single-family detached present and 6 months remain locked in downtrends from last year’s lofty heights. I was hoping the Spring selling season would dramatically turn these around. These numbers suggest on-going caution is warranted and seem to confirm a plateau for the Spring selling season.
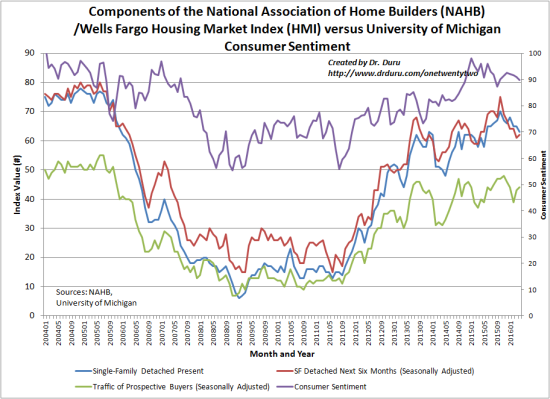
Source: The National Association of Home Builders (NAHB)
In April, the three-month moving averages for regional HMI scores declined in all four regions of the country. These declines undermine a bit the apparent stabilization at the aggregate level: “The Northeast and West each fell two points to 44 and 67, respectively. Meanwhile, the Midwest and South each posted respective one-point losses to 57 and 58.”
Parting thoughts
As I have indicated throughout this review, I think the data and trading technicals are flashing signs of caution for trades on home builders. As a reminder, here are the charts I posted last month to demonstrate the strong (relative) seasonality of trading home builders (see my article on this topic for details):
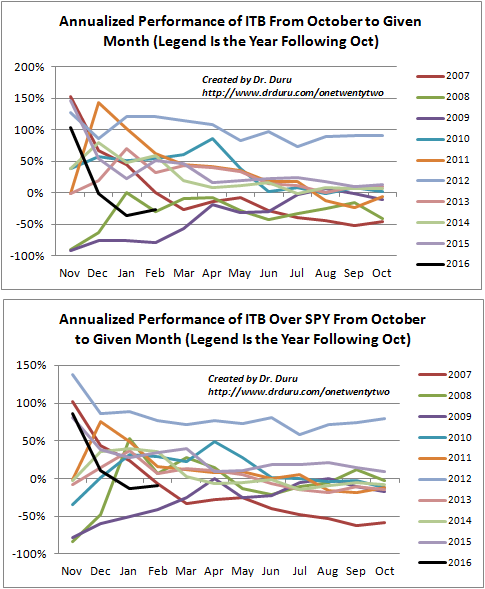
Source for price data: Yahoo Finance
Again, I have not suddenly become bearish. I just think the odds for near-term upside no longer out-weight the near-term risks. This assessment impacts my remaining positions in home builders: Century Communities, Inc. (CCS), iShares US Home Construction (ITB), Toll Brothers (TOL), and TRI Pointe Group, Inc. (TPH).
CCS is struggling to break through 200DMA resistance. I am a primary fan of regional home builders, so I have stuck by CCS for a LONG time while accumulating shares). However, I think it is time to take profits. The stock is STILL incredibly cheap at 9.6 trailing P/E, 6.0 forward P/E, and a bargain basement 0.9 price/book. Investors clearly do not want to pay up for CCS – I guess it STILL needs to prove out its acquisition strategy. The big bet on Atlanta is a risky one. Regardless, I am a buyer on dips… perhaps sooner than on any other home builder. I will be intently reviewing earnings on May 5th.
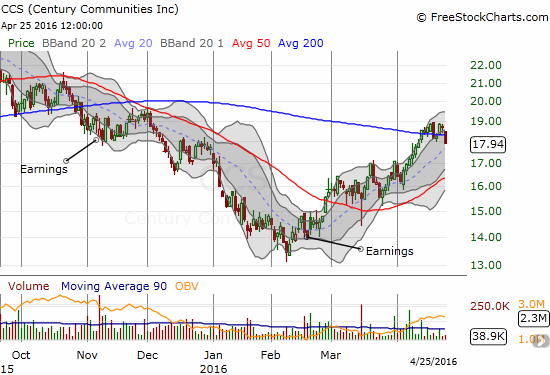
As discussed above, I think ITB has plateaued for the seasonal trade. So, I will take my profits in ITB and wait for the next entry opportunity.
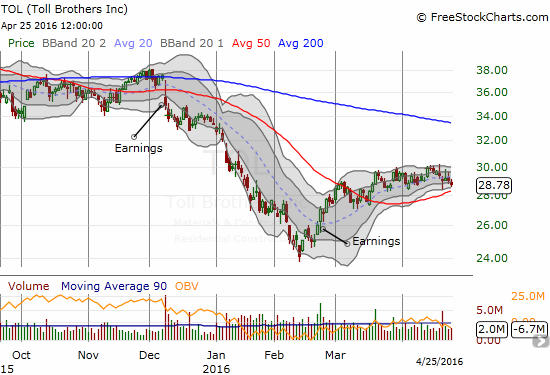
Toll Brothers (TOL) is a huge enigma. The stock remains reasonably priced at 14.9 trailing P/E, 9.5 forward P/E, and 1.21 price/book. The stock is WELL off its recent and multi-year highs. At the risk of selling my winners and holding my losers, I am going to keep hanging with TOL (currently a 7.2% loss on the my small position). Like CCS, I am eager to buy TOL on future dips.
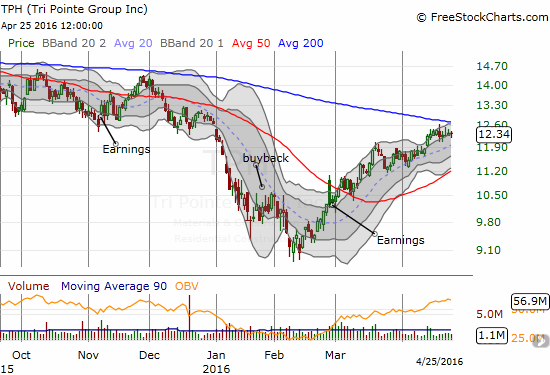
TRI Pointe Group, Inc. (TPH) is my big bet on the Californian housing market, but I am starting to lose my patience. With the housing data in the West softening (or at least becoming less reliable), my trigger for taking my loss on TPH is getting closer (despite lowering my base on accumulated shares and the current rally, loss is still at 15%). The company initiated a buyback in January, so I really want to see how that plays out against the next earnings cycle. In the meantime, TPH has 200DMA resistance directly above. Earnings are coming in two days. I will be eagerly awaiting commentary on Western region sales.
Be careful out there!
Full disclosure: long CCS, ITB, TOL, and TPH
